Bluerock Residential Growth REIT Announces Third Quarter 2018 Results
Total Revenues Grew 59% YoY to $47.9 Million
Industry-Leading Same Store Revenue Growth of 4.8% YoY
New York, NY (November 5, 2018) – Bluerock Residential Growth REIT, Inc. (NYSE American: BRG) (“the Company”), an owner of highly amenitized multifamily apartment communities, announced today its financial results for the quarter ended September 30, 2018.
Third Quarter Highlights
- Total revenues grew 59% to $47.9 million for the quarter from $30.2 million in the prior year period.
- Net loss attributable to common stockholders for the third quarter of 2018 was ($0.44) per share, as compared to ($0.45) per share in the prior year period.
- Property Net Operating Income (“NOI”) grew 52% to $24.2 million, from $16.0 million in the prior year period.
- Same store revenue and NOI increased 4.8% and 4.0% respectively, as compared to the prior year period.
- Core funds from operations attributable to common shares and units (“CFFO”) increased 67% to $6.4 million, from $3.8 million in the prior year period. CFFO per share is $0.21 for the third quarter as compared to $0.14 in the prior year period. Dividend payout on a CFFO basis improved to 77% during the third quarter.
- Adjusted funds from operations attributable to common shares and units (“AFFO”) grew 67% to $5.7 million, from $3.4 million in the prior year period. AFFO per share is $0.18 for the quarter as compared to $0.13 in third quarter 2017.
- Consolidated real estate investments, at cost, increased approximately $197.5 million to $1.7 billion, from December 31, 2017.
- The Company invested approximately $16 million in a multifamily community totaling 400 units with a total purchase price of $40.2 million and $3 million to buy out a noncontrolling interest in one asset.
- The Company completed 385 value-add unit upgrades for a year-to-date total of 847 upgrades at an average cost of $4,555 per unit. The Company expects to complete between 900 and 1,200 unit renovations in 2018.
- Since inception within the existing portfolio, the Company has completed 1,327 value-add unit upgrades and achieved a $107 average monthly rental increase per unit, equating to a 26.7% ROI on all unit upgrades leased as of September 30, 2018. The Company has identified approximately 4,600 remaining units within the existing portfolio for value-add upgrades with similar economics to the completed renovations.
- The Company is increasing the low end of its full year 2018 AFFO guidance range from $0.66 to $0.68 per share and is affirming the top end of the range at $0.70 per share. This represents the second consecutive quarter with a guidance increase.
“Our third quarter results clearly demonstrate the successful execution of our strategic initiatives, including value-add investments and accretive approach to growing our portfolio,” said Ramin Kamfar, Company Chairman and CEO. “We continued to perform well in the third quarter, with property NOI up 52% and on a CFFO basis we improved our dividend payout to 77% in the third quarter. Our same store operational results are among the best in the multifamily industry, reflecting the contribution from our unit upgrades and our focus on knowledge economy growth markets. These strong results have allowed us to again raise the lower end of our 2018 AFFO guidance range. We believe we have ample runway to continue to create additional value as we focus on accretive operational improvements and completing our value-add unit upgrade programs.”
Financial Results
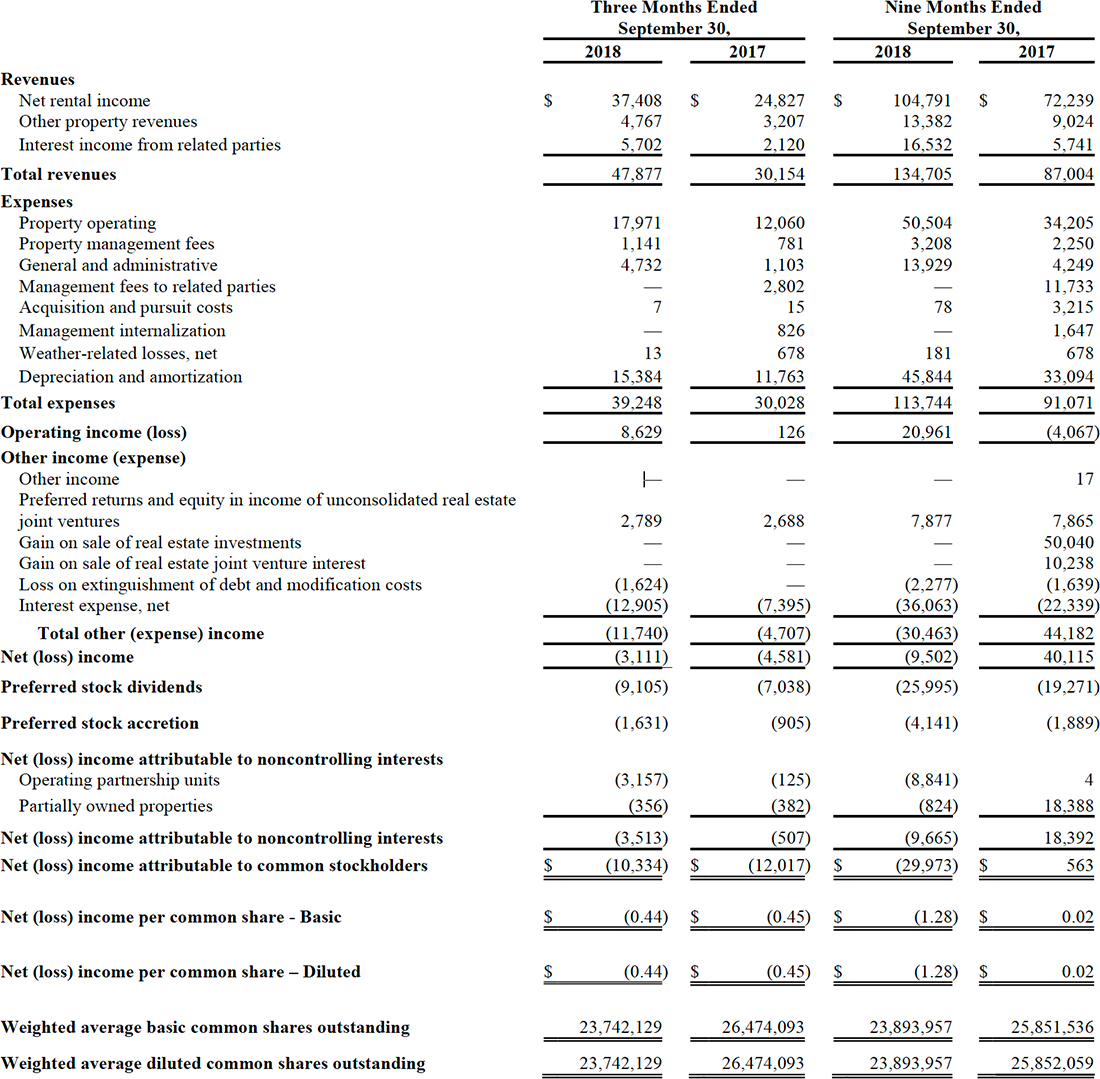
Net loss attributable to common stockholders for the third quarter of 2018 was $10.3 million, compared to $12.0 million in the prior year period. Net loss attributable to common stockholders included non-cash expenses of $14.2 million or $0.46 per share in the third quarter of 2018 compared to $14.8 million or $0.55 per share for the prior year period.
AFFO for the third quarter of 2018 was $5.7 million, or $0.18 per diluted share, compared to $3.4 million, or $0.13 per diluted share in the prior year period. AFFO was primarily driven by growth in property NOI of $8.2 million and interest income of $3.6 million arising from significant investment activity. This was primarily offset by a year-over-year increase in interest expense of $5.1 million, general and administrative expenses of $2.1 million, and preferred stock dividends of $2.1 million.
Core FFO for the third of 2018 was $6.4 million, or $0.21 per diluted share, compared to $3.8 million, or $0.14 per diluted share in the prior year period. Core FFO adds back non-cash, non-operating expenses such as accretion on the Company’s Series B preferred stock.
Total Portfolio Performance
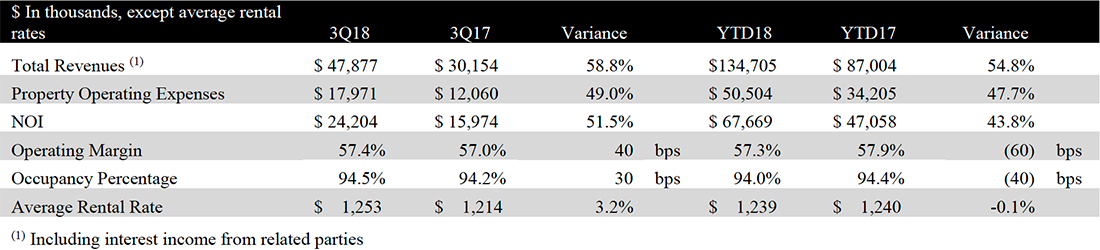
For the third quarter of 2018, property revenues increased by 50.4% compared to the same prior year period primarily attributable to the increased size of the portfolio. Total portfolio NOI was $24.2 million, an increase of $8.2 million, or 51.5%, compared to the same period in the prior year. Property operating expenses were up primarily due to the increased size of the portfolio.
Property NOI margins were 57.4% of revenue for the quarter, compared to 57.0% of revenue in the prior year quarter.
Same Store Portfolio Performance
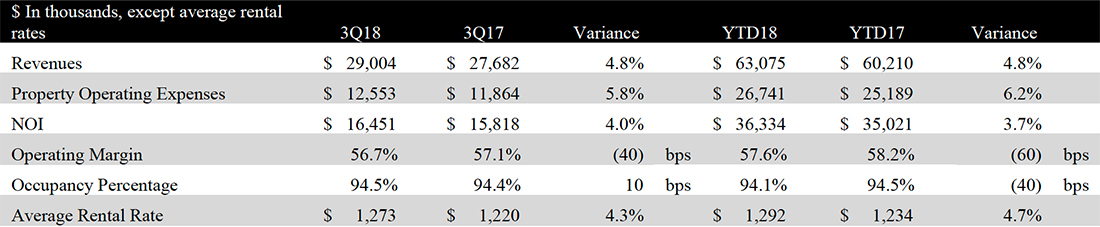
The Company’s same store portfolio for the quarter ended September 30, 2018 included 22 properties. For the third quarter of 2018, same store NOI was $16.5 million, an increase of $0.6 million, or 4.0%, compared to the same period in the prior year. Same store property revenues increased by 4.8% compared to the same prior year period, primarily attributable to a 4.3% increase in average rental rates, as well as average occupancy increasing 10 basis points to 94.5%. Same store expenses increased $0.69 million, primarily due to $0.40 million of additional real estate taxes due to higher valuations by municipalities, $0.17 million due to recurring annual maintenance incurred in the current year on certain properties which was not required in the prior year as the properties were undergoing renovations, and $0.11 million related to payroll increase.
Acquisition Activity
On July 26, 2018, the Company acquired a 93% interest in a 400-unit apartment community located in Houston, Texas, known as Veranda at Centerfield. The total purchase price was approximately $40.2 million, funded in part by a $26.1 million mortgage loan secured by the Veranda at Centerfield property.
On August 29, 2018, the Company invested approximately $3 million to increase our ownership stake to 100% in our ARIUM Palms property.
Balance Sheet
During the third quarter, the Company raised gross proceeds of approximately $29.8 million through the issuance of 29,829 shares of Series B preferred stock with associated warrants at $1,000 per unit.
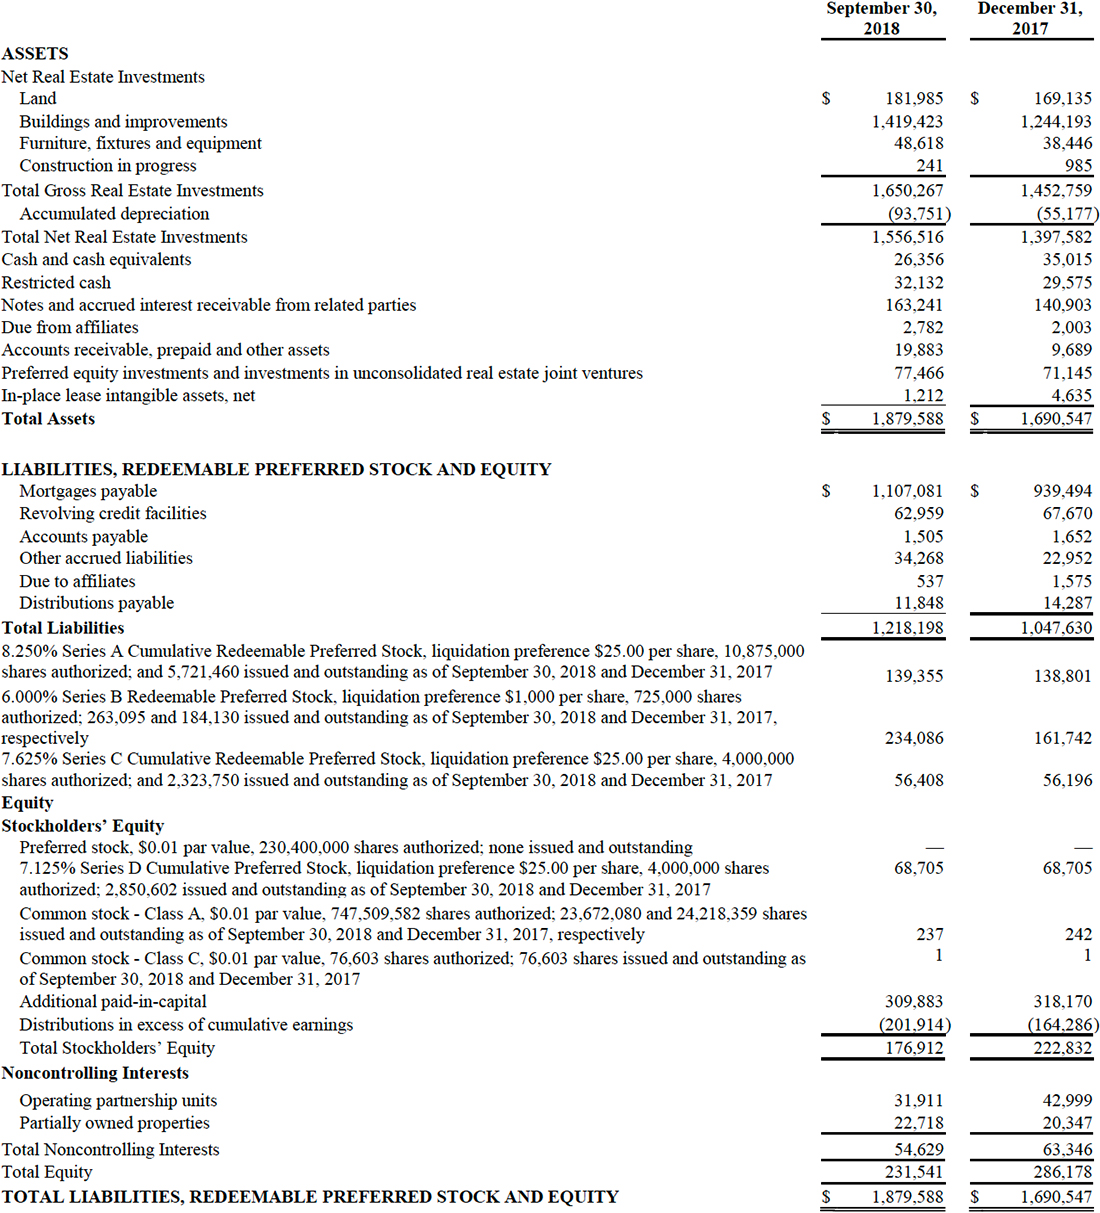
As of September 30, 2018, the Company had $26.4 million of unrestricted cash on its balance sheet, approximately $56.1 million available among its revolving credit facilities, and $1.2 billion of debt outstanding.
Dividend
The Board of Directors authorized, and the Company declared, a quarterly dividend for the third quarter of 2018 equal to a quarterly rate of $0.1625 per share on its Class A common stock, payable to the stockholders of record as of September 25, 2018, which was paid in cash on October 5, 2018. A portion of each dividend may constitute a return of capital for tax purposes. There is no assurance that we will continue to declare dividends or at this rate.
On July 10, 2018, the Board of Directors authorized, and the Company declared, a monthly dividend of $5.00 per share of Series B preferred stock, payable to the stockholders of record as of July 25, 2018, August 24, 2018, and September 25, 2018 which was paid in cash on August 3, 2018, September 5, 2018, and October 5, 2018, respectively.
2018 Guidance
Based on the Company’s current outlook and market conditions, the Company is increasing the low end of the 2018 AFFO guidance from $0.66 to $0.68 per share and is reaffirming the top end of the range at $0.70 per share.
For additional guidance details, please see page 32 of Company’s Third Quarter 2018 Earnings Supplement available under Investor Relations on the Company’s website (www.bluerockresidential.com). Subsequent to issuing 2018 guidance in February 2018, the Company revised its presentation of AFFO attributable to common stockholders to reflect AFFO attributable to common shares and units. The estimated weighted average diluted shares and units outstanding used to calculate AFFO per share now includes noncontrolling interests – operating partnership units. As the Company’s presentation now also includes the impact of AFFO attributable to operating partnership units, and as shares and units are treated on a one-for-one basis, there is no change to projected AFFO per share for purposes of 2018 AFFO guidance.
Conference Call
All interested parties can listen to the live conference call at 11:00 AM ET on Monday, November 5, 2018 by dialing +1 (866) 843-0890 within the U.S., or +1 (412) 317-6597, and requesting the “Bluerock Residential Conference.”
For those who are not available to listen to the live call, the conference call will be available for replay on the Company’s website two hours after the call concludes, and will remain available until December 6, 2018 at http://services.choruscall.com/links/brg181106.html, as well as by dialing +1 (877) 344-7529 in the U.S., or +1 (412) 317-0088 internationally, and requesting conference number 10125116.
The full text of this Earnings Release and additional Supplemental Information is available in the Investor Relations section on the Company’s website at https://www.bluerockresidential.com.
About Bluerock Residential Growth REIT, Inc.
Bluerock Residential Growth REIT, Inc. (NYSE American: BRG) is a real estate investment trust that focuses on developing and acquiring a diversified portfolio of institutional-quality highly amenitized live/work/play apartment communities in demographically attractive knowledge economy growth markets to appeal to the renter by choice. The Company’s objective is to generate value through off-market/relationship-based transactions and, at the asset level, through value add improvements to properties and operations. The Company is included in the Russell 2000 and Russell 3000 Indexes. BRG has elected to be taxed as a real estate investment trust (REIT) for U.S. federal income tax purposes.
For more information, please visit the Company’s website at www.bluerockresidential.com.
Forward Looking Statements
This press release contains forward-looking statements within the meaning of the Private Securities Litigation Reform Act of 1995 and other federal securities laws. These forward-looking statements are based upon the Company’s present expectations, but these statements are not guaranteed to occur. Furthermore, the Company disclaims any obligation to publicly update or revise any forward-looking statement to reflect changes in underlying assumptions or factors, of new information, data or methods, future events or other changes. Investors should not place undue reliance upon forward-looking statements. For further discussion of the factors that could affect outcomes, please refer to the risk factors set forth in Item 1A of the Company’s Annual Report on Form 10-K filed by the Company with the U.S. Securities and Exchange Commission (“SEC”) on March 13, 2018, and subsequent filings by the Company with the SEC. We claim the safe harbor protection for forward looking statements contained in the Private Securities Litigation Reform Act of 1995.
Portfolio Summary
The following is a summary of our operating real estate and mezzanine/preferred investments as of September 30, 2018:
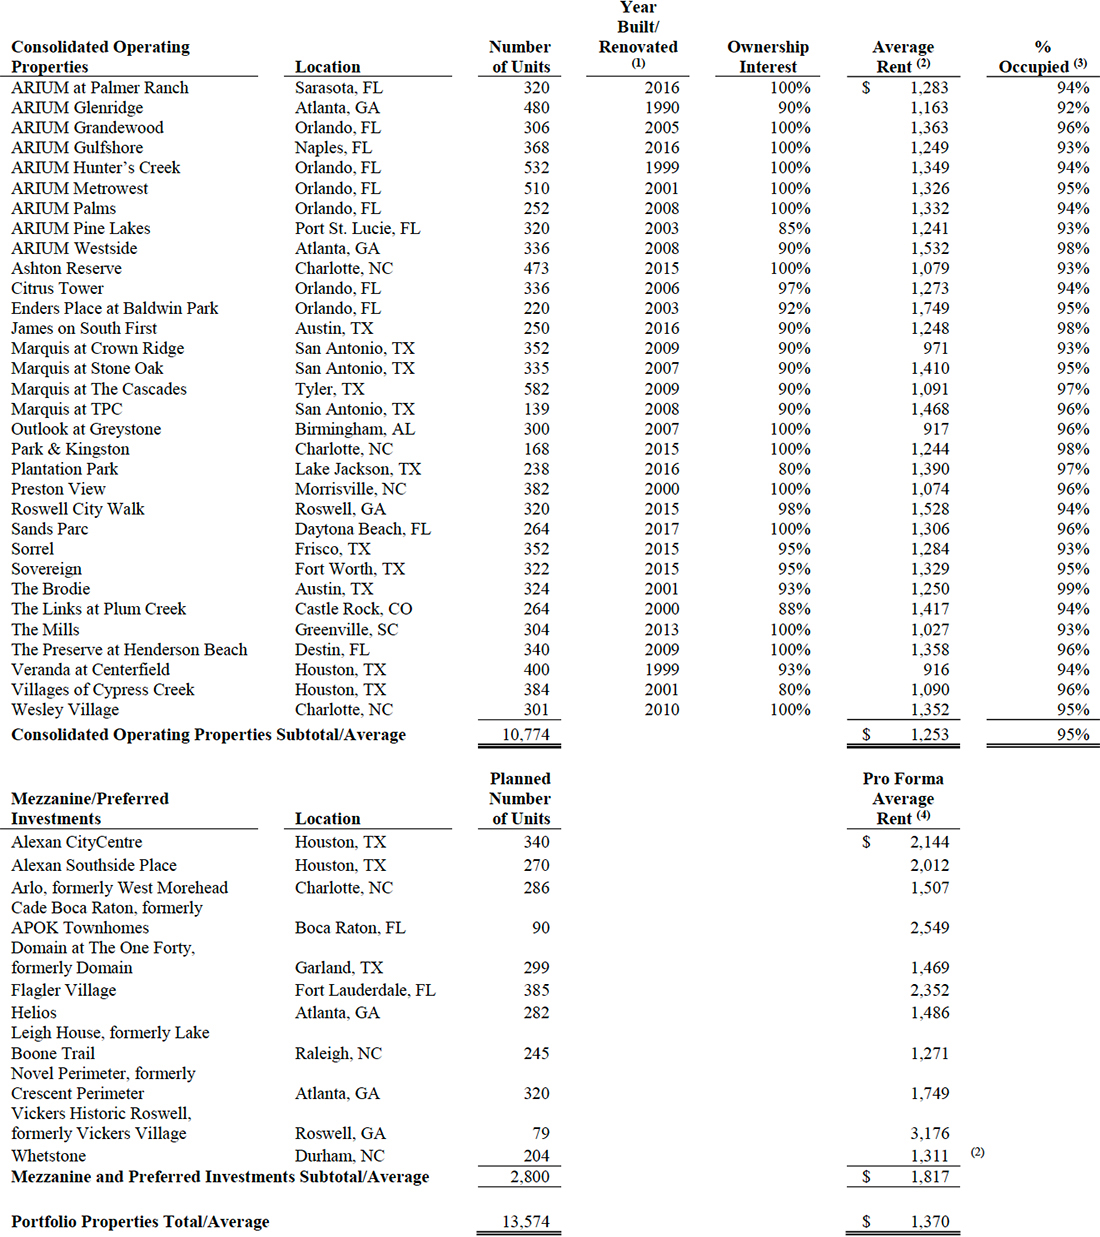
(1) Represents date of last significant renovation or year built if there were no renovations.
(2) Represents the average effective monthly rent per occupied unit for the three months ended September 30, 2018.
(3) Percent occupied is calculated as (i) the number of units occupied as of September 30, 2018, divided by (ii) total number of units, expressed as a percentage.
(4) Alexan CityCentre, Alexan Southside Place, Helios, Leigh House, and Whetstone are preferred equity investments. The Alexan Southside Place, Helios, and Leigh House investments have the option to convert to indirect common interest in the property once the property reaches 70% occupancy. Arlo, Cade Boca Raton, Domain at The One Forty, Flagler Village, Novel Perimeter, and Vickers Historic Roswell are mezzanine loan investments. Additionally, Arlo, Cade Boca Raton, Domain at The One Forty, and Vickers Historic Roswell have an option to purchase indirect property interest upon maturity.
Consolidated Statement of Operations
For the Three and Nine Months Ended September 30, 2018 and 2017
(Unaudited and dollars in thousands except for share and per share data)
Consolidated Balance Sheets
Third Quarter 2018
(Unaudited and dollars in thousands except for share and per share amounts)
Non-GAAP Financial Measures
The foregoing supplemental financial data includes certain non-GAAP financial measures that we believe are helpful in understanding our business and performance, as further described below. Our definition and calculation of these non-GAAP financial measures may differ from those of other REITs, and may, therefore, not be comparable.
Funds from Operations, Core Funds from Operations, and Adjusted Funds from Operations
We believe that funds from operations (“FFO”), as defined by the National Association of Real Estate Investment Trusts (“NAREIT”), core funds from operations (“Core FFO”), and adjusted funds from operations (“AFFO”) are important non-GAAP supplemental measures of operating performance for a REIT.
FFO attributable to common shares and units is a non-GAAP financial measure that is widely recognized as a measure of REIT operating performance. We consider FFO to be an appropriate supplemental measure of our operating performance as it is based on a net income analysis of property portfolio performance that excludes non-cash items such as depreciation. The historical accounting convention used for real estate assets requires straight-line depreciation of buildings and improvements, which implies that the value of real estate assets diminishes predictably over time. Since real estate values historically rise and fall with market conditions, presentations of operating results for a REIT, using historical accounting for depreciation, could be less informative. We define FFO, consistent with the NAREIT definition, as net income, computed in accordance with GAAP, excluding gains (or losses) from sales of property, plus depreciation and amortization of real estate assets, plus impairment write-downs of depreciable real estate, and after adjustments for unconsolidated partnerships and joint ventures. Adjustments for unconsolidated partnerships and joint ventures will be calculated to reflect FFO on the same basis.
Core FFO makes certain adjustments to FFO, removing the effect of items that do not reflect ongoing property operations such as stock compensation expense, acquisition expenses, unrealized gains and losses on derivatives, losses on extinguishment of debt and modification costs (includes prepayment penalties incurred and the write-off of unamortized deferred financing costs and fair market value adjustments of assumed debt), non-cash interest, one-time weather-related costs, and preferred stock accretion. We believe that Core FFO is helpful to investors as a supplemental performance measure because it excludes the effects of certain items which can create significant earnings volatility, but which do not directly relate to our core recurring property operations. As a result, we believe that Core FFO can help facilitate comparisons of operating performance between periods and provides a more meaningful predictor of future earnings potential.
AFFO makes certain adjustments to Core FFO in order to arrive at a more refined measure of the operating performance of our portfolio. There is no industry standard definition of AFFO and practice is divergent across the industry. AFFO adjusts Core FFO for items that impact our ongoing operations, such as subtracting recurring capital expenditures (and while we were externally managed, when calculating the quarterly incentive fee paid to our former Manager only, we further adjusted FFO to include any realized gains or losses on our real estate investments). We believe that AFFO is helpful to investors as a meaningful supplemental indicator of our operational performance.
Our calculation of Core FFO and AFFO differs from the methodology used for calculating Core FFO and AFFO by certain other REITs and, accordingly, our Core FFO and AFFO may not be comparable to Core FFO and AFFO reported by other REITs. Our management utilizes FFO, Core FFO, and AFFO as measures of our operating performance after adjustment for certain non-cash items, such as depreciation and amortization expenses, and acquisition and pursuit costs that are required by GAAP to be expensed but may not necessarily be indicative of current operating performance and that may not accurately compare our operating performance between periods. Furthermore, although FFO, Core FFO, AFFO and other supplemental performance measures are defined in various ways throughout the REIT industry, we also believe that FFO, Core FFO, and AFFO may provide us and our stockholders with an additional useful measure to compare our financial performance to certain other REITs. While we were externally managed, we also used AFFO for purposes of determining the quarterly incentive fee paid to our former Manager in prior periods.
Neither FFO, Core FFO, nor AFFO is equivalent to net income, including net income attributable to common stockholders, or cash generated from operating activities determined in accordance with GAAP. Furthermore, FFO, Core FFO, and AFFO do not represent amounts available for management’s discretionary use because of needed capital replacement or expansion, debt service obligations or other commitments or uncertainties. Neither FFO, Core FFO, nor AFFO should be considered as an alternative to net income, including net income attributable to common stockholders, as an indicator of our operating performance or as an alternative to cash flow from operating activities as a measure of our liquidity.
We have acquired interests in eight additional operating properties subsequent to September 30, 2017. Therefore, the results presented in the table below are not directly comparable and should not be considered an indication of our future operating performance.
The table below reconciles our calculations of FFO, Core FFO and AFFO to net (loss) income, the most directly comparable GAAP financial measure, for the three and nine months ended September 30, 2018 and 2017 (in thousands, except per share amounts):
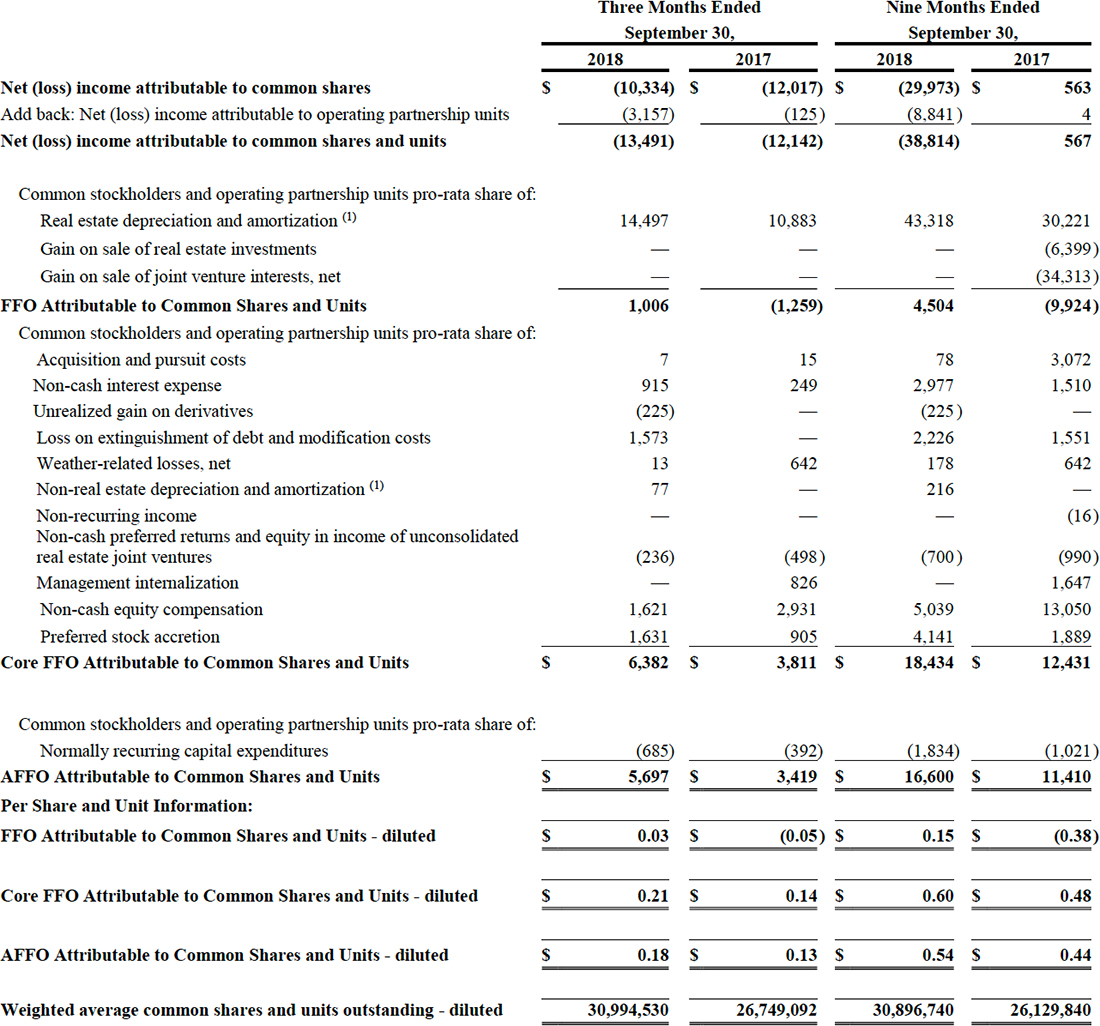
(1) The real estate depreciation and amortization amount includes our share of consolidated real estate-related depreciation and amortization of intangibles, less amounts attributable to noncontrolling interests – partially owned properties, and our similar estimated share of unconsolidated depreciation and amortization, which is included in earnings of our unconsolidated real estate joint venture investments.
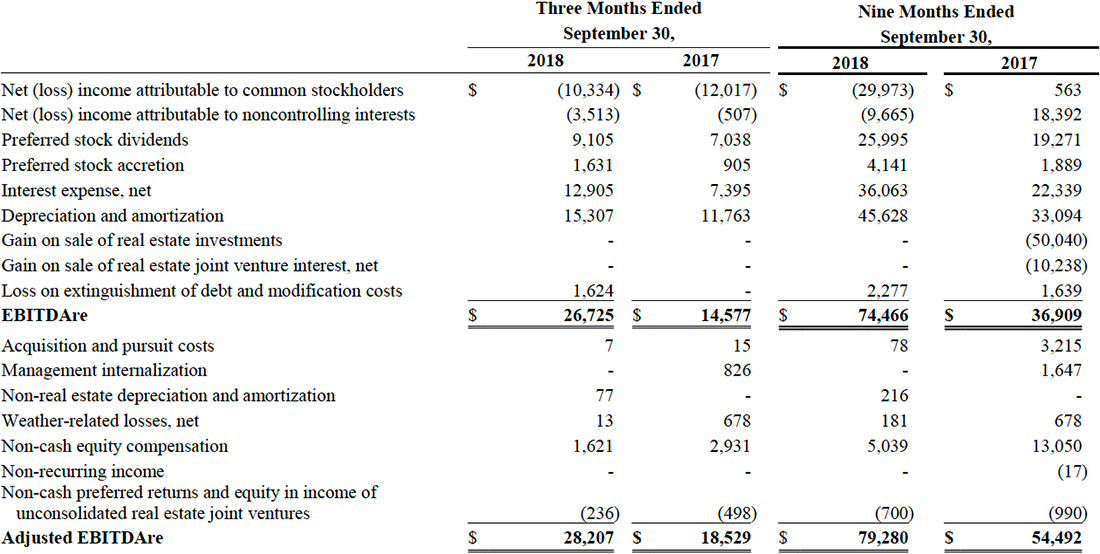
Earnings Before Interest, Taxes, Depreciation and Amortization for Real Estate (“EBITDAre”)
NAREIT defines earnings before interest, taxes, depreciation and amortization for real estate (“EBITDAre”) (September 2017 White Paper) as net income, computed in accordance with GAAP, before interest expense, income taxes, depreciation and amortization expense, and further adjusted for gains and losses from sales of depreciated operating properties, and impairment write-downs of depreciated operating properties.
We consider EBITDAre to be an appropriate supplemental measure of our performance because it eliminates depreciation, income taxes, interest and non-recurring items, which permits investors to view income from operations unobscured by non-cash items such as depreciation, amortization, the cost of debt or non-recurring items.
Adjusted EBITDAre represents EBITDAre further adjusted for non-comparable items and it is not intended to be a measure of free cash flow for our management’s discretionary use, as it does not consider certain cash requirements such as income tax payments, debt service requirements, capital expenditures and other fixed charges.
EBITDAre and Adjusted EBITDAre are not recognized measurements under GAAP. Because not all companies use identical calculations, our presentation of EBITDAre and Adjusted EBITDAre may not be comparable to similarly titled measures of other companies.
Below is a reconciliation of net (loss) income attributable to common stockholders to EBITDAre (unaudited and dollars in thousands).
Recurring Capital Expenditures
We define recurring capital expenditures as expenditures that are incurred at every property and exclude development, investment, revenue enhancing and non-recurring capital expenditures.
Non-Recurring Capital Expenditures
We define non-recurring capital expenditures as expenditures for significant projects that upgrade units or common areas and projects that are revenue enhancing.
Same Store Properties
Same store properties are conventional multifamily residential apartments which were owned and operational for the entire periods presented, including each comparative period.
Property Net Operating Income (“Property NOI”)
We believe that net operating income, or NOI, is a useful measure of our operating performance. We define NOI as total property revenues less total property operating expenses, excluding depreciation and amortization and interest. Other REITs may use different methodologies for calculating NOI, and accordingly, our NOI may not be comparable to other REITs. We believe that this measure provides an operating perspective not immediately apparent from GAAP operating income or net income. We use NOI to evaluate our performance on a same store and non-same store basis; NOI measures the core operations of property performance by excluding corporate level expenses and other items not related to property operating performance and captures trends in rental housing and property operating expenses. However, NOI should only be used as a supplemental measure of our financial performance.
Certain amounts in prior periods, related to tenant reimbursements for utility expenses amounting to zero and $3.0 million for the three and nine months ended September 30, 2017, have been reclassified to other property revenues from property operating expenses, to conform to the current period. In addition, property management fees have been reclassified from property operating expenses.
The following table reflects net (loss) income attributable to common stockholders together with a reconciliation to NOI and to same store and non-same store contributions to consolidated NOI, as computed in accordance with GAAP for the periods presented (unaudited and amounts in thousands):
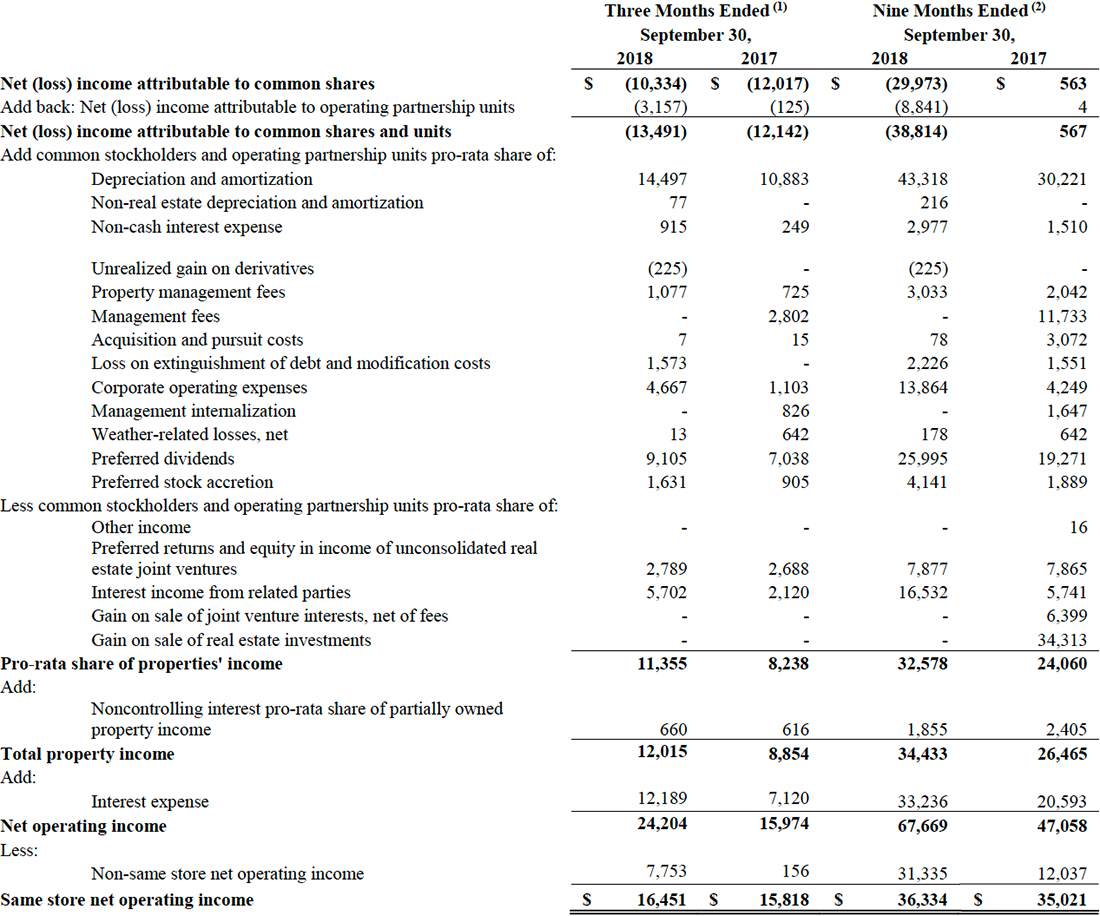
(1) Same Store sales for the three months ended September 30, 2018 related to the following properties: Enders Place at Baldwin Park, ARIUM Grandewood, Park & Kingston, ARIUM Palms, Ashton Reserve, Sovereign, Sorrel, ARIUM at Palmer Ranch, ARIUM Gulfshore, The Preserve at Henderson Beach, ARIUM Westside, ARIUM Pine Lakes, James on South First, ARIUM Glenridge, Roswell City Walk, The Brodie, Preston View, Wesley Village, Marquis at Crown Ridge, Marquis at Stone Oak, Marquis at The Cascades, and Marquis at TPC.
(2) Same Store sales for the nine months ended September 30, 2018 related to the following properties: Enders Place at Baldwin Park, ARIUM Grandewood, Park & Kingston, ARIUM Palms, Ashton Reserve, Sovereign, Sorrel, ARIUM at Palmer Ranch, ARIUM Gulfshore, The Preserve at Henderson Beach, ARIUM Westside, ARIUM Pine Lakes, James on South First, ARIUM Glenridge, Roswell City Walk, and The Brodie