Bluerock Residential Growth REIT Announces First Quarter 2017 Results
New York, NY (May 8, 2017) – Bluerock Residential Growth REIT, Inc. (NYSE MKT: BRG) (“the Company”) announced today its financial results for the quarter ended March 31, 2017.
Highlights
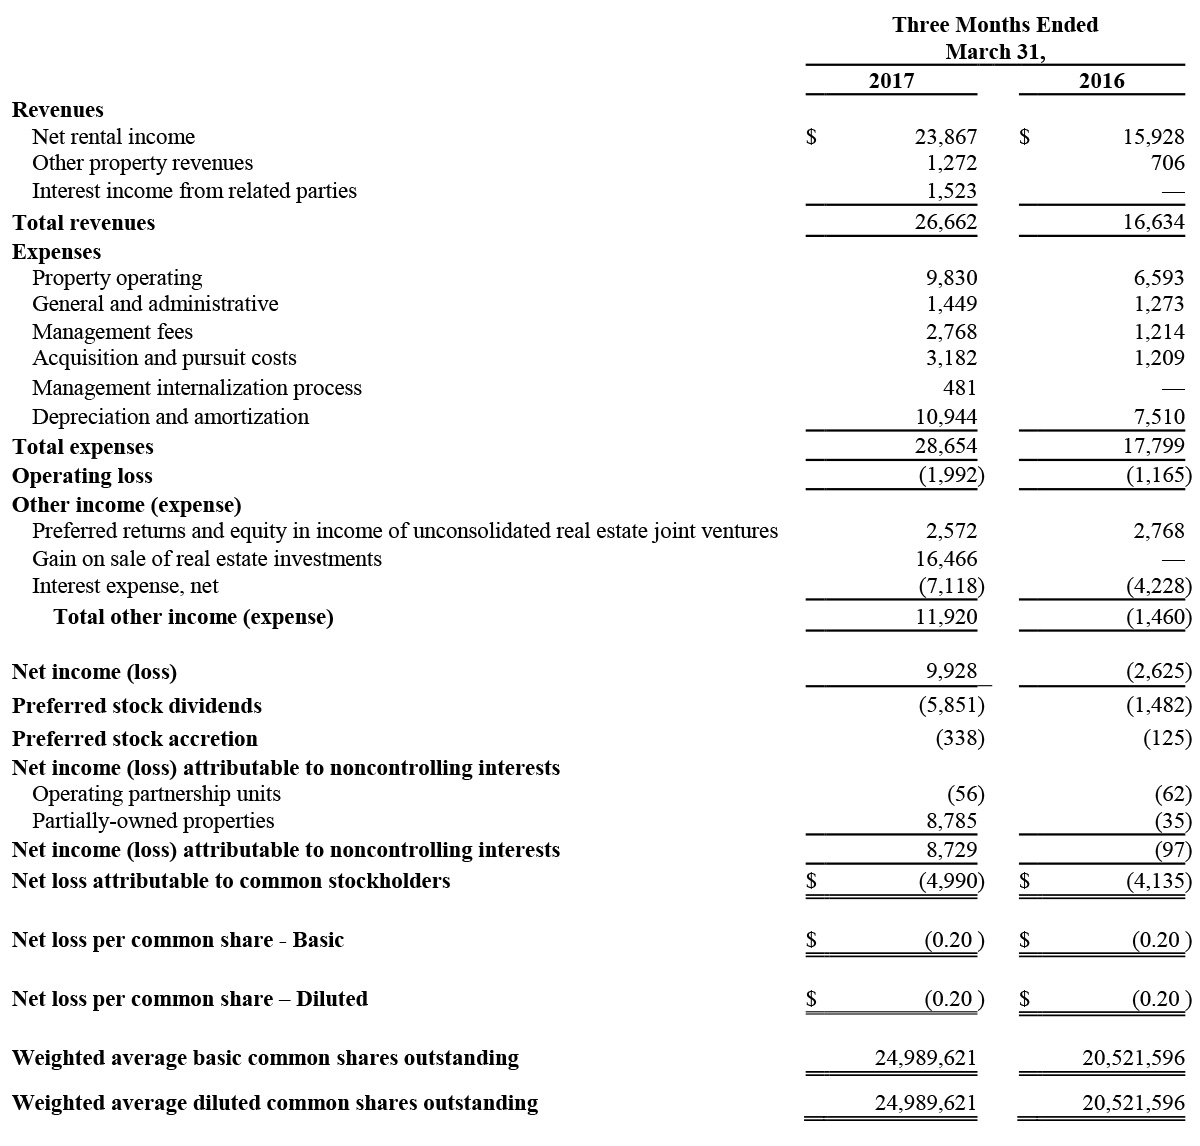
- Total revenues grew 61% to $26.7 million for the quarter from $16.6 million for the prior year quarter primarily as a result of significant investment activity in the past year.
- Net loss attributable to common stockholders for the first quarter of 2017 was $(0.20) per share, as compared to $(0.20) per share in the prior year period. Net loss attributable to common stockholders included non-cash expenses of $0.55 per share in the first quarter of 2017 vs. $0.41 per share for the prior year period.
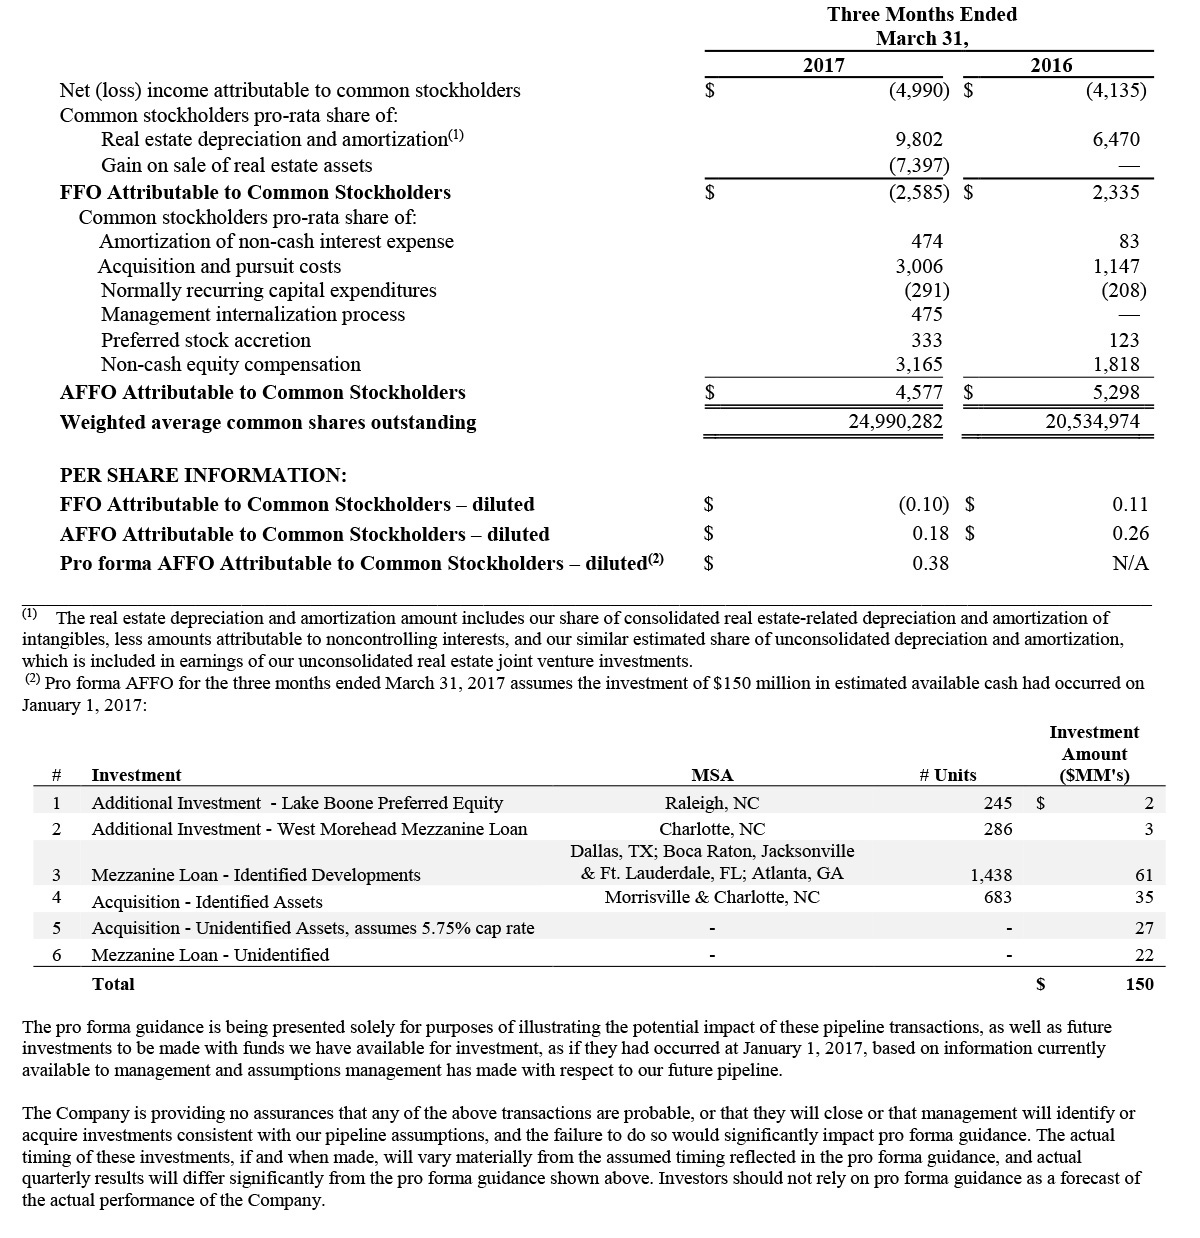
- Adjusted funds from operations attributable to common stockholders (“AFFO”) was $4.6 million for the quarter compared to $5.3 million for the prior year quarter.
- AFFO per share is $0.18 for the first quarter of 2017 as compared to $0.26 for the first quarter of 2016, and exceeded guidance of $0.03 – $0.04.
- Pro forma AFFO per share of $0.38 for the first quarter exceeded pro forma guidance of $0.27 to $0.29 per share.
- The Company paid the full amount of the first quarter’s management fees of $2.8 million in LTIP Units in lieu of cash payment. This favorably impacted both AFFO per share and pro forma AFFO per share by $0.09.
- Property Net Operating Income (NOI) grew 53% to $15.3 million for the quarter, from $10.0 million in the prior year quarter.
- Property NOI margins were 60.9% of revenue for the quarter, an improvement from 60.4% of revenue in the prior year quarter.
- Same store NOI increased 10.9% for the quarter, as compared to the prior year quarter.
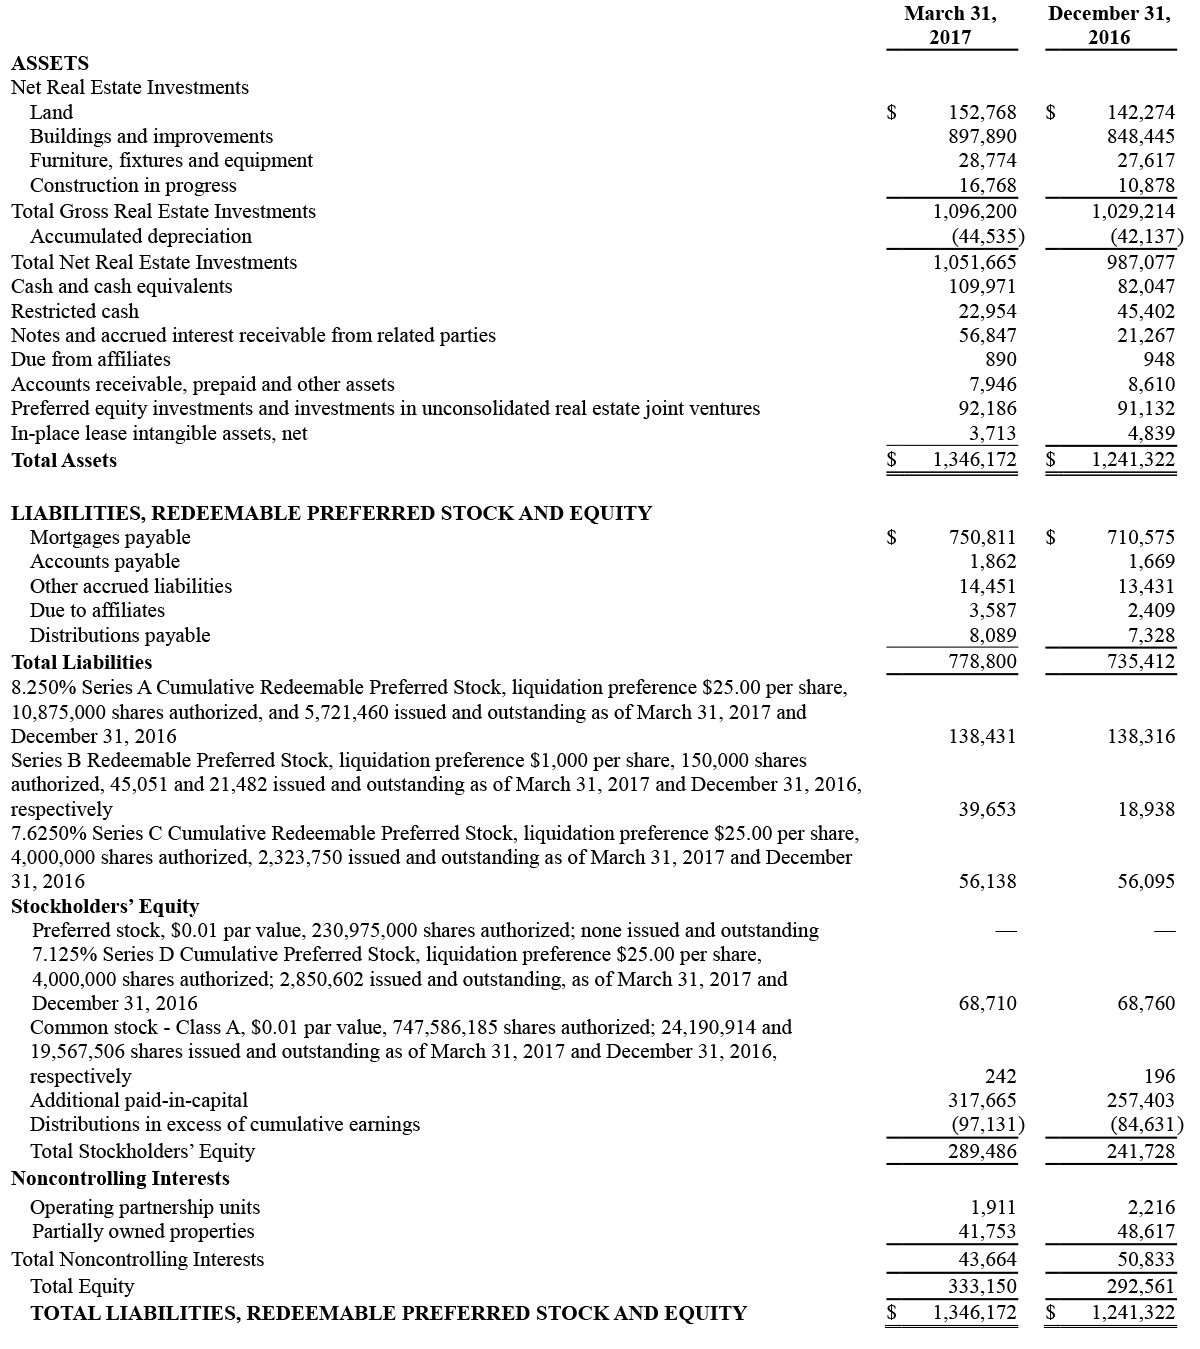
- Consolidated real estate investments, at cost, increased 7% to $1.1 billion at March 31, 2017 from $1.0 billion at December 31, 2016.
- The Company invested in two operating properties totaling 683 units for a total purchase price of approximately $116.7 million during the first quarter.
- The Company declared monthly dividends for the second quarter of 2017 equal to a quarterly rate of $0.29 per share on the Company’s Class A common stock. This equates to an 9.4% annualized yield based on the closing price of $12.31 for the Class A common stock as of March 31, 2017.
- The Company sold 23,569 shares of Series B preferred stock with associated warrants at a public offering price of $1,000 per unit, for gross proceeds of approximately $23.6 million during the first quarter, an increase of 86% over the fourth quarter.
- On January 17, 2017, the Company completed an underwritten offering of 4.6 million shares of Class A common stock at a public offering price of $13.15 per share for gross proceeds of $60.5 million, including the underwriters’ overallotment option, which closed on January 24, 2017.
Management Commentary
“We are pleased to report the acquisition of two operating properties totaling 683 units for approximately $117 million, a Class A common stock capital raise with gross proceeds of approximately $60 million and solid portfolio performance during the first quarter,” said Ramin Kamfar, the Company’s Chairman and CEO. “We continue to build a high quality portfolio in our current footprint of growth markets in the Sunbelt, from the Carolinas to Florida and Texas.”
First Quarter Acquisition, Development and Disposition Activity
- On December 29, 2016, the Company was redeemed of its preferred equity interest in the West Morehead development in Charlotte, North Carolina, and in exchange obtained a 0.5% common equity interest and provided an approximately $21.3 million mezzanine loan for the development. On January 5, 2017, the Company increased the mezzanine loan amount to approximately $24.6 million.
- On January 6, 2017, the Company was redeemed of the substantial majority of its common equity ownership interest in the APOK Townhomes development in Boca Raton, Florida, and in exchange provided an approximately $11.2 million mezzanine loan for the development.
- On February 17, 2017, the Company acquired a 91.8% interest in a 382-unit apartment community located in Morrisville, North Carolina, which is part of the Raleigh-Durham Combined Statistical Area, known as Preston View Apartments at a total purchase price of approximately $59.5 million.
- On March 3, 2017, the Company was redeemed of its preferred equity interest in the Domain development located in Garland, Texas, and in exchange obtained a 0.5% common equity interest and provided an approximately $20.3 million mezzanine loan for the development.
- On March 9, 2017, the Company acquired a 91.8% interest in a 301-unit apartment community in Charlotte, North Carolina, known as Wesley Village Apartments at a total purchase price of approximately $57.2 million.
- On February 22, 2017, the Company sold its interest in the Village Green of Ann Arbor apartments in Ann Arbor, Michigan at a total sale price of approximately $71.4 million, recognized a pro rata gain of $7.8 million, with net proceeds of approximately $13.6 million to the Company, generating an internal rate of return of 38% on BRG’s equity investment in the project, for a return on equity of 2.32x.
The Company has determined to abandon the pursuit of the East San Marco proposed development in Jacksonville, Florida and has expensed all predevelopment expenditures amounting to approximately $2.9 million which is included in acquisition and pursuit costs on the statement of operations.
Pending Investments and Pending Sales at March 31, 2017
- The Company has an agreement which entitles the Company to make a 90% investment in a 1,408-unit five-property portfolio of multifamily communities located in San Antonio and Tyler, Texas. The total purchase price of approximately $188.9 million includes the assumption of approximately $147.7 million of existing mortgage debt.
- On April 26, 2017, the Company closed on the sale of Lansbrook Village, located in Palm Harbor, Florida after all sale contingencies were met. The 90% owned property was sold for approximately $82.4 million. After deduction for assumption of the existing mortgage indebtedness of $57.2 million and payment of closing costs and fees, the sale of the property generated net proceeds to the Company of approximately $19.1 million, generating an internal rate of return of 23% on BRG’s equity investment, for a return on equity of 1.5x.
First Quarter 2017 Financial Results
Net loss attributable to common stockholders for the first quarter of 2017 was $5.0 million, compared to a net loss of $4.1 million in the prior year period. The change in net loss was primarily driven by positive increases in property NOI of $5.3 million, interest income of $1.5 million and a gain on sale of real estate investments of $16.5 million, offset by increases in management fees of $1.6 million, acquisition and pursuit costs of $2.0 million, management internalization process expense of $0.5 million, depreciation and amortization expense of $3.4 million, interest expense of $2.9 million, preferred stock expense of $4.6 million and non-controlling income allocation of $8.8 million.
AFFO for the first quarter of 2017 was $4.6 million, or $0.18 per diluted share, compared to $5.3 million, or $0.26 per share in the prior year period. AFFO was positively impacted by increases in property NOI of $5.3 million arising from significant investment activity, interest income of $1.5 million and offset by interest expense of $2.5 million and the expense of preferred stock dividends of $4.4 million.
Same Store Portfolio Performance
Same store NOI for the first quarter of 2017 increased by 10.9% from the same period in the prior year. There was a 6.2% increase in same store property revenues compared to the same prior year period, primarily attributable to a 4.7% increase in average rental rates, an 80 basis point increase in average occupancy and an additional 12 units acquired at our Lansbrook property. Same store expenses decreased 0.8% due to lower real estate tax expense in 2017.
Management Internalization
On November 7, 2016, the Company announced that it had begun the process of internalizing the management of the Company by forming a special committee of the board of directors comprised solely of the independent directors of the board to pursue the internalization, along with hiring other advisors. The Company is targeting internalizing the management of the Company in the third quarter of 2017, though it provides no assurance as to the timing or completion of the internalization process.
Dividend Details
On April 7, 2017, our board of directors authorized, and we declared, monthly dividends for the second quarter of 2017 equal to a quarterly rate of $0.29 per share on our Class A common stock, payable to the stockholders of record as of April 25, 2017, which was paid in cash on May 5, 2017, and as of May 25, 2017 and June 23, 2017, which will be paid in cash on June 5, 2017 and July 5, 2017, respectively. Holders of OP and LTIP Units are entitled to receive “distribution equivalents” at the same time as dividends are paid to holders of our Class A common stock.
The declared dividends equal a monthly dividend on the Class A common stock as follows: $0.096666 per share for the dividend paid to stockholders of record as of April 25, 2017, $0.096667 per share for the dividend which will be paid to stockholders of record as of May 25, 2017, and June 23, 2017. A portion of each dividend may constitute a return of capital for tax purposes. There is no assurance that we will continue to declare dividends or at this rate.
On April 7, 2017, our board of directors authorized, and we declared, a monthly dividend of $5.00 per share of Series B preferred stock, payable to the stockholders of record as of April 25, 2017, which was paid in cash on May 5, 2017, and as of May 25, 2017, and June 23, 2017, which will be paid in cash on June 5, 2017 and July 5, 2017, respectively.
Q2 2017 Outlook
For the second quarter of 2017, the Company anticipates AFFO in the range of $0.01 to $0.02 per share, and $0.26 to $0.28 per share on a pro forma basis. For assumptions underlying earnings guidance, please see page 29 of Company’s Q1 2017 Earnings Supplement available under Investor Relations on the Company’s website (www.bluerockresidential.com). Pro forma AFFO is used for illustrative purposes only, is hypothetical and does not represent historical performance or management’s estimates or projections for future performance.
Conference Call
All interested parties can listen to the live conference call at 11:00 AM ET on Monday, May 8, 2017 by dialing +1 (866) 843-0890 within the U.S., or +1 (412) 317-6597, and requesting the “Bluerock Residential Conference.”
For those who are not available to listen to the live call, the conference call will be available for replay on the Company’s website two hours after the call concludes, and will remain available until June 8, 2017 at http://services.choruscall.com/links/brg170508.html, as well as by dialing +1 (877) 344-7529 in the U.S., or +1 (412) 317-0088 internationally, and requesting conference number 10105342.
The full text of this Earnings Release and additional Supplemental Information is available in the Investor Relations section on the Company’s website at https://www.bluerockresidential.com.
About Bluerock Residential Growth REIT, Inc.
Bluerock Residential Growth REIT, Inc. (NYSE MKT: BRG) is a real estate investment trust that focuses on acquiring a diversified portfolio of Class A institutional-quality apartment properties in demographically attractive growth markets to appeal to the renter by choice. The Company’s objective is to generate value through off-market/relationship-based transactions and, at the asset level, through improvements to operations and properties. BRG generally invests with strategic regional partners, including some of the best-regarded private owner-operators in the United States, making it possible to operate as a local sharpshooter in each of its markets while enhancing off-market sourcing capabilities. The Company is included in the Russell 2000 and Russell 3000 Indexes. BRG has elected to be taxed as a real estate investment trust (REIT) for U.S. federal income tax purposes.
For more information, please visit the Company’s website at www.bluerockresidential.com.
Forward Looking Statements
This press release contains forward-looking statements within the meaning of the Private Securities Litigation Reform Act of 1995 and other federal securities laws. These forward-looking statements are based upon the Company’s present expectations, but these statements are not guaranteed to occur. Furthermore, the Company disclaims any obligation to publicly update or revise any forward-looking statement to reflect changes in underlying assumptions or factors, of new information, data or methods, future events or other changes. Investors should not place undue reliance upon forward-looking statements. For further discussion of the factors that could affect outcomes, please refer to the risk factors set forth in Item 1A of the Company’s Annual Report on Form 10-K filed by the Company with the U.S. Securities and Exchange Commission (“SEC”) on February 22, 2017, and subsequent filings by the Company with the SEC. We claim the safe harbor protection for forward looking statements contained in the Private Securities Litigation Reform Act of 1995.
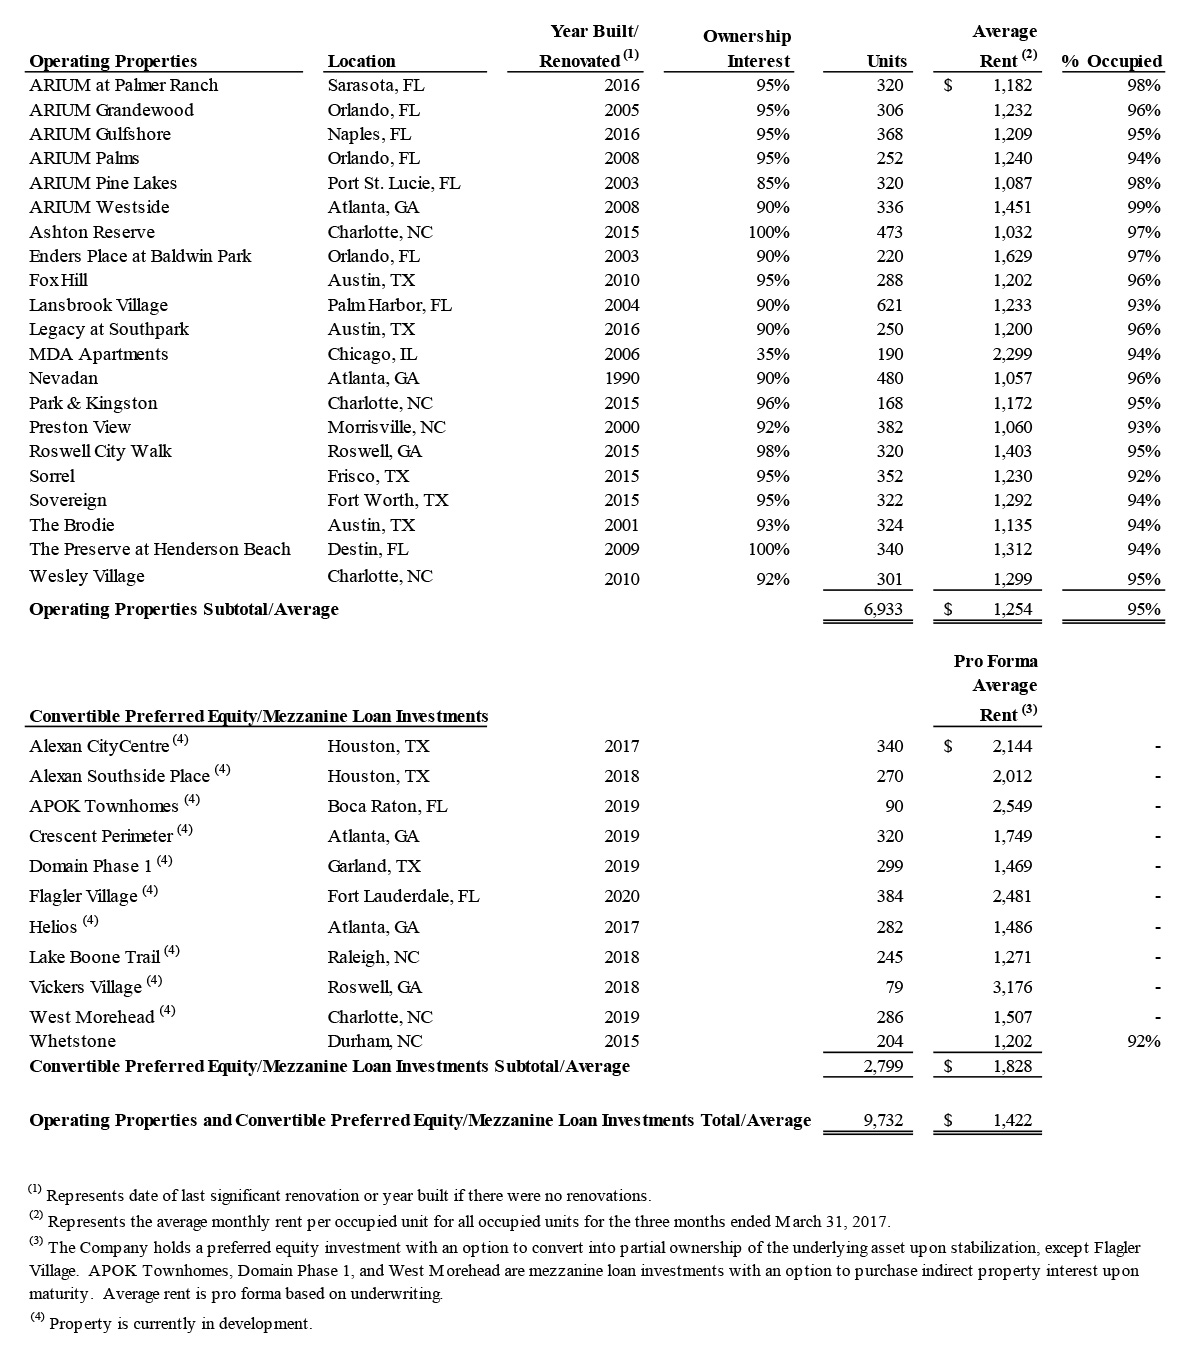
Portfolio Summary
The following summary of our investments, operating properties and convertible preferred equity investments, as of March 31, 2017:
Consolidated Statement of Operations
For the Three Months Ended March 31, 2017 and 2016
(Unaudited and dollars in thousands except for share and per share data)
Consolidated Balance Sheets
First Quarter 2017
(Unaudited and dollars in thousands except for share and per share amounts)
Non-GAAP Financial Measures
The foregoing supplemental financial data includes certain non-GAAP financial measures that we believe are helpful in understanding our business and performance, as further described below. Our definition and calculation of these non-GAAP financial measures may differ from those of other REITs, and may, therefore, not be comparable.
Funds from Operations and Adjusted Funds from Operations
Funds from operations attributable to common stockholders (“FFO”) is a non-GAAP financial measure that is widely recognized as a measure of REIT operating performance. We consider FFO to be an appropriate supplemental measure of our operating performance as it is based on a net income analysis of property portfolio performance that excludes non-cash items such as depreciation. The historical accounting convention used for real estate assets requires straight-line depreciation of buildings and improvements, which implies that the value of real estate assets diminishes predictably over time. Since real estate values historically rise and fall with market conditions, presentations of operating results for a REIT, using historical accounting for depreciation, could be less informative. We define FFO, consistent with the National Association of Real Estate Investment Trusts, or (“NAREIT’s”) definition, as net income, computed in accordance with GAAP, excluding gains (or losses) from sales of property, plus depreciation and amortization of real estate assets, plus impairment write-downs of depreciable real estate, and after adjustments for unconsolidated partnerships and joint ventures. Adjustments for unconsolidated partnerships and joint ventures will be calculated to reflect FFO on the same basis.
In addition to FFO, we use adjusted funds from operations attributable to common stockholders (“AFFO”). AFFO is a computation made by analysts and investors to measure a real estate company’s operating performance by removing the effect of items that do not reflect ongoing property operations. To calculate AFFO, we further adjust FFO by adding back certain items that are not added to net income in NAREIT’s definition of FFO, such as acquisition and pursuit expenses, equity based compensation expenses, and any other non-recurring or non-cash expenses, which are costs that do not relate to the operating performance of our properties, and subtracting recurring capital expenditures (and when calculating the quarterly incentive fee payable to our Manager only, we further adjust FFO to include any realized gains or losses on our real estate investments).
Our calculation of AFFO differs from the methodology used for calculating AFFO by certain other REITs and, accordingly, our AFFO may not be comparable to AFFO reported by other REITs. Our management utilizes FFO and AFFO as measures of our operating performance after adjustment for certain non-cash items, such as depreciation and amortization expenses, and acquisition and pursuit costs that are required by GAAP to be expensed but may not necessarily be indicative of current operating performance and that may not accurately compare our operating performance between periods. Furthermore, although FFO, AFFO and other supplemental performance measures are defined in various ways throughout the REIT industry, we also believe that FFO and AFFO may provide us and our stockholders with an additional useful measure to compare our financial performance to certain other REITs. We also use AFFO for purposes of determining the quarterly incentive fee, if any, payable to our Manager.
Neither FFO nor AFFO is equivalent to net income, including net income attributable to common stockholders, or cash generated from operating activities determined in accordance with GAAP. Furthermore, FFO and AFFO do not represent amounts available for management’s discretionary use because of needed capital replacement or expansion, debt service obligations or other commitments or uncertainties. Neither FFO nor AFFO should be considered as an alternative to net income, including net income attributable to common stockholders, as an indicator of our operating performance or as an alternative to cash flow from operating activities as a measure of our liquidity.
We have acquired interests in eight additional operating properties and one investment accounted for on the equity method of accounting and sold three properties subsequent to March 31, 2016. The results presented in the table below are not directly comparable and should not be considered an indication of our future operating performance.
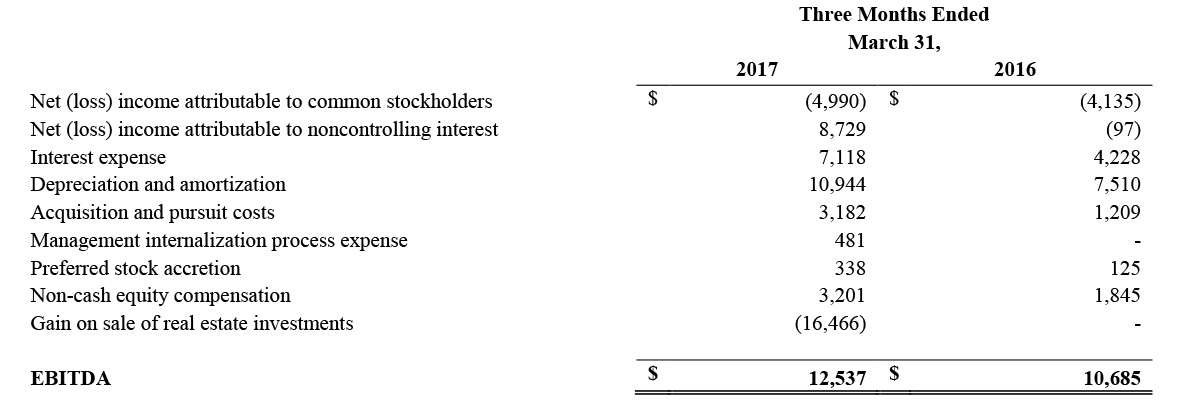
Earnings Before Interest, Income Taxes, Depreciation and Amortization (“EBITDA”)
EBITDA is defined as earnings before interest, income taxes, depreciation and amortization, calculated on a consolidated basis. We consider EBITDA to be an appropriate supplemental measure of our performance because it eliminates depreciation, income taxes, interest and non-recurring items, which permits investors to view income from operations unobscured by non-cash items such as depreciation, amortization, the cost of debt or non-recurring items. Below is a reconciliation of net loss attributable to common stockholders to EBITDA (unaudited and dollars in thousands).
Recurring Capital Expenditures
We define recurring capital expenditures as expenditures that are incurred at every property and exclude development, investment, revenue enhancing and non-recurring capital expenditures.
Non-Recurring Capital Expenditures
We define non-recurring capital expenditures as expenditures for significant projects that upgrade units or common areas and projects that are revenue enhancing.
Same Store Properties
Same store properties are conventional multifamily residential apartments which were owned and operational for the entire periods presented, including each comparative period.
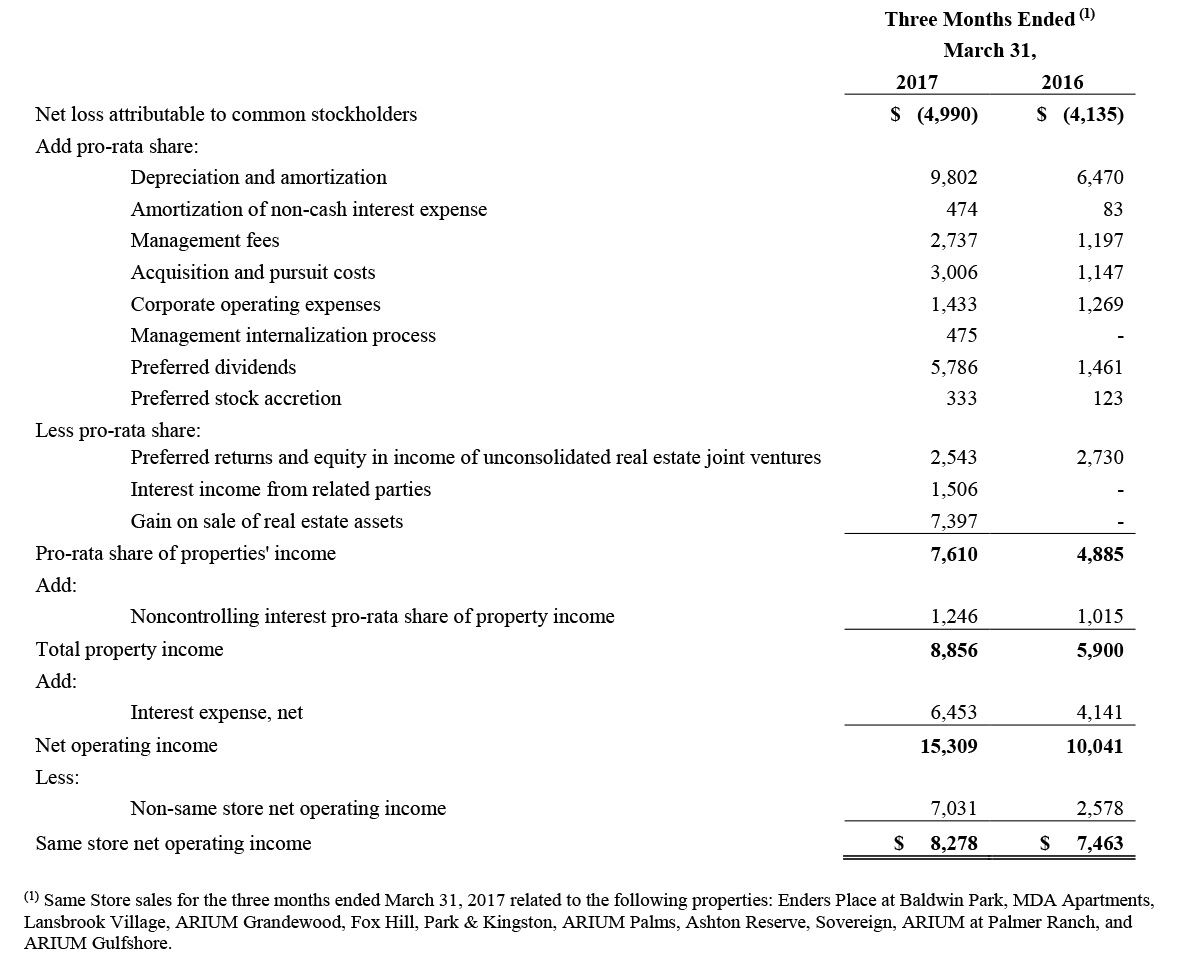
Property Net Operating Income (“Property NOI”)
We believe that net operating income, or NOI, is a useful measure of our operating performance. We define NOI as total property revenues less total property operating expenses, excluding depreciation and amortization and interest. Other REITs may use different methodologies for calculating NOI, and accordingly, our NOI may not be comparable to other REITs. We believe that this measure provides an operating perspective not immediately apparent from GAAP operating income or net income. We use NOI to evaluate our performance on a same store and non-same store basis because NOI measures the core operations of property performance by excluding corporate level expenses and other items not related to property operating performance and captures trends in rental housing and property operating expenses. However, NOI should only be used as an alternative measure of our financial performance.
The following table reflects same store and non-same store contributions to consolidated NOI together with a reconciliation of NOI to net loss attributable to common stockholders as computed in accordance with GAAP for the periods presented (unaudited and amounts in thousands):
Contact (Media)
Josh Hoffman
(208) 475.2380
jhoffman@bluerockre.com