Bluerock Residential Growth REIT Announces First Quarter 2020 Results
Total Revenues Grew 9% YoY
Same Store Revenues Grew 3.1% YoY
Collected 97% of April and 92% of May Rents Including Payment Plans
New York, NY (May 11, 2020) – Bluerock Residential Growth REIT, Inc. (NYSE American: BRG) (“the Company”), an owner of highly amenitized multifamily apartment communities, announced today its financial results for the quarter ended March 31, 2020.
First Quarter Highlights
- Total revenues grew 9% to $56.2 million for the quarter from $51.5 million in the prior year period.
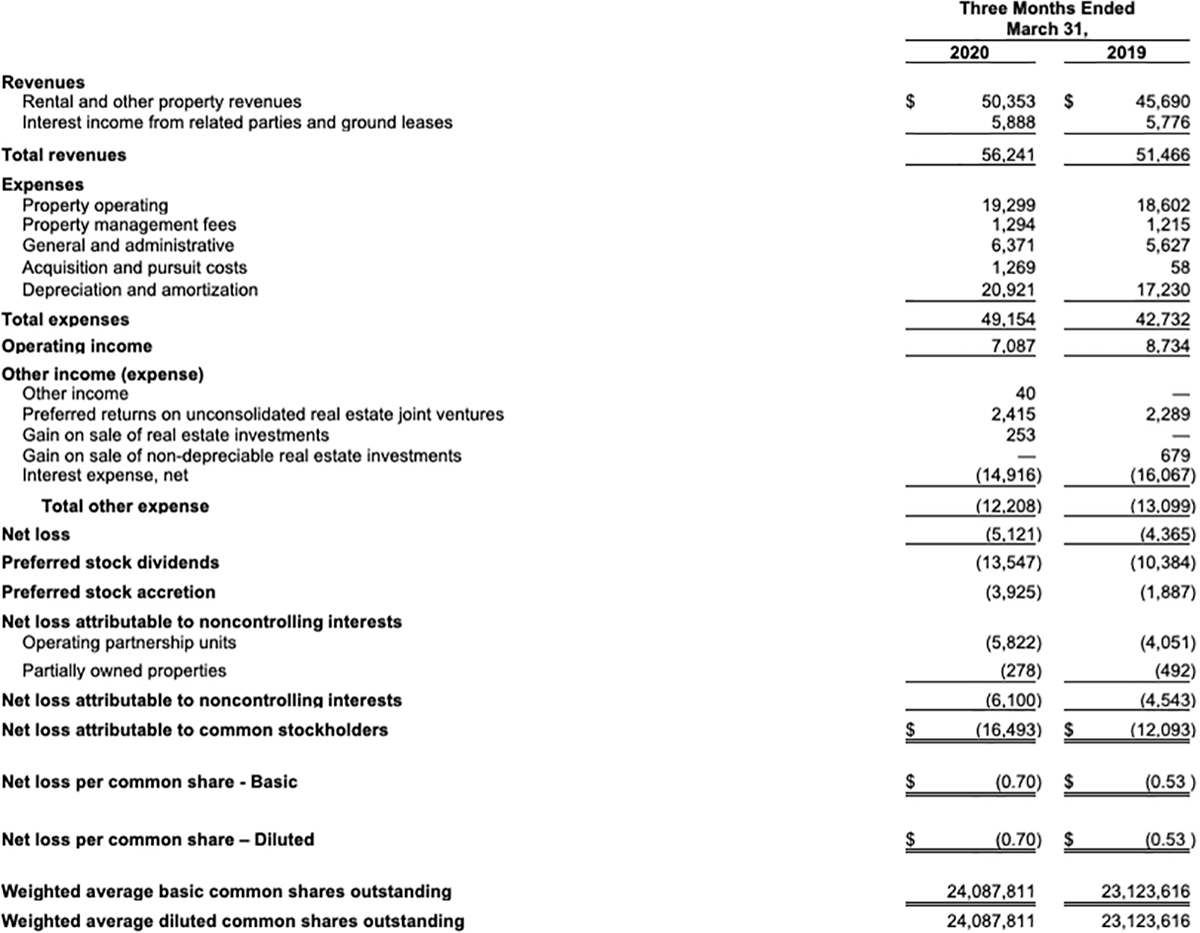
- Net loss attributable to common stockholders for the first quarter of 2020 was ($0.70) per share, as compared to ($0.53) per share in the prior year period. Net loss attributable to common stockholders includes non-cash items, including depreciation and amortization expense, of $0.88 per share in the first quarter of 2020 compared to $0.74 per share for the prior year period.
- Property Net Operating Income (“NOI”) grew 15% to $31.1 million, from $27.1 million in the prior year period.
- Same store revenue and NOI increased 3.1% and 2.6% respectively, as compared to the prior year period.
- Improved operating margins by 240 basis points year over year to 61.7%.
- Core funds from operations attributable to common shares and units (“CFFO”) increased 13% to $7.1 million, from $6.3 million in the prior year period. CFFO per share was up 10% to $0.22 for the first quarter as compared to $0.20 in the prior year period.
- Consolidated real estate investments, at cost, were approximately $2.2 billion.
- Completed the following investments:
- Two multifamily communities totaling 610 units for a total purchase price of $138 million.
- Preferred equity and mezzanine loan investments totaling $14 million, including in two multifamily communities totaling 408 units in Savannah, Georgia and Pensacola, Florida, and additional fundings for seven multifamily developments.
- Purchased land for a ground lease for $3 million and committed $20 million for the ground lease tenant’s multifamily development.
- Completed the following dispositions:
- Sold an asset underlying an unconsolidated joint venture and one operating property for an aggregate sales price of $112 million, for net proceeds of $42 million.
- In April 2020, closed on sales of three properties for $160 million which were entered into pre-COVID-19.
- Completed 120 value-add unit upgrades during the quarter achieving an average 21.8% ROI.
- Paid quarterly dividend of $0.1625 in cash per share of common stock, a 74% payout ratio on a CFFO basis.
- Raised $57.4 million through its registered Series T Preferred Stock offering in the quarter.
Included later in this release are definitions of NOI, CFFO and other Non-GAAP financial measures and reconciliations of such measures to their most comparable financial measures as calculated and presented under GAAP.
COVID-19 Pandemic Update
The Company’s first quarter performance did not incur significant impact from the COVID-19 pandemic. The Company is closely monitoring COVID-19’s impact on its business, properties, tenants, partners and employees and the full impact of the COVID-19 pandemic on rental revenues and overall financial performance remains uncertain.
Health and Safety Protocols
Since the beginning of the COVID-19 pandemic, the Company executed on actions to prioritize the health and well-being of its tenants, business partners, service providers and employees, while striving to provide the highest quality living experience possible and facilitating virtual leasing.
- All of the Company’s multifamily communities have remained open and are complying with federal, state and local shelter-in-place orders and remain accessible for our tenants, although non-essential amenity spaces such as club houses, pools and fitness centers, have been closed as required.
- Implemented enhanced protocols for the sanitization of community common areas.
- All communications, leasing efforts, and resident servicing remain fully functional primarily through direct appointments, digital and virtual means.
- Leasing at all communities continues through the implementation of virtual tours and online leasing for prospective tenants.
- Implemented working from home policies for BRG corporate employees.
Post-Quarter Operational Performance
- As of May 9, 2020, the Company has collected 97% of April rents from its multifamily properties, including payment plans of 1%, and 92% of May rents, including payment plans of 2%.
- Occupancy remains strong at 94.3% as of April 30, 2020.
Current Liquidity
Due to the uncertainties presented by the COVID-19 pandemic, the Company has taken a number of measures to increase its liquidity and believes it has sufficient liquidity through this uncertain period.
- The Company has approximately $117.9 million in cash and $51 million of capacity on its credit facilities as of May 8, 2020.
- Over $22 million has been raised from the Company’s continuous Series T Preferred Stock offering since March 31, 2020.
“We are committed to the health, safety, and well-being of our employees, business partners, service providers and tenants. We thank our dedicated team that continues to ensure that our properties maintain their high standard of service in spite of the challenges from COVID-19,” said Ramin Kamfar, Company Chairman and CEO. “We are pleased with the strong operating results in the first quarter. We are encouraged by the rental collections in April and May which reflect the quality and stability of our investments in highly amenitized, live/work/play apartment communities in knowledge-based job economies; such as health care, technology, education, sciences and finance sectors, but recognize that we may face some challenges in the future due to the impact of COVID-19. We have taken steps to bolster our cash position to effectively navigate the current crisis and to ensure that we have the capital to continue executing on our investment strategy.”
First Quarter 2020 Financial Results
Net loss attributable to common stockholders for the first quarter of 2020 was $16.5 million, compared to $12.1 million in the prior year period. Net loss attributable to common stockholders included non-cash expenses of $20.9 million or $0.88 per share in the first quarter of 2020 compared to $17.2 million or $0.74 per share for the prior year period.
CFFO for the first quarter of 2019 was $7.1 million, or $0.22 per diluted share, compared to $6.3 million, or $0.20 per diluted share, in the prior year period. CFFO adds back non-cash, non-operating expenses such as accretion on the Company’s Series B preferred stock. CFFO was primarily driven by growth in property NOI of $4.0 million, interest income of $0.1 million and preferred returns of $0.3 million. This was primarily offset by a year-over-year increase in interest expense of $0.4 million and preferred stock dividends of $3.2 million.
Total Portfolio Performance
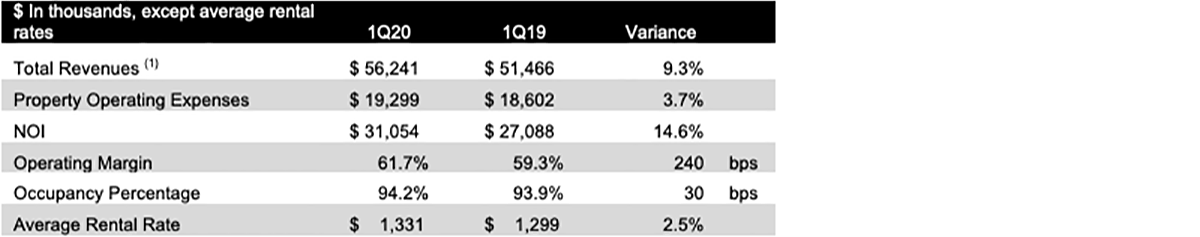
(1) Including interest income from related parties
For the first quarter of 2020, property revenues increased by 10.2% compared to the same prior year period primarily attributable to the increased size of the portfolio. Total portfolio NOI was $31.1 million, an increase of $4.0 million, or 14.6%, compared to the same period in the prior year. Property operating expenses were up primarily due to the increased size of the portfolio.
Property NOI margins expanded by 240 basis points to 61.7% of revenue for the quarter, compared to 59.3% of revenue in the prior year quarter.
Same Store Portfolio Performance
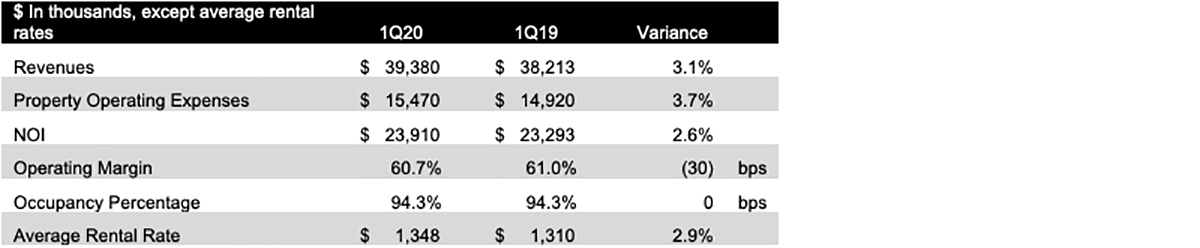
The Company’s same store portfolio for the quarter ended March 31, 2020 included 27 properties. For the first quarter of 2020, same store NOI was $23.9 million, an increase of $0.6 million, or 2.6%, compared to the same period in the prior year. Same store property revenues grew by 3.1% compared to the same prior year period, primarily attributable to a 2.9% increase in average rental rates as twenty-five of the Company’s twenty-seven same store properties recognized rental rate increases during the period.
Same store expenses increased 3.7%, or $0.55 million, of which $0.5 million or 3.4% was due to non-controllable expenses. Real estate taxes increased $0.3 million from prior year due to municipality tax increases. In addition, insurance expenses increased $0.2 million due to industrywide multifamily price increases stemming from carrier losses over the past two years.
Renovation Activity
The Company completed 120 value-add unit upgrades during the first quarter achieving a 21.8% ROI. Since inception, within the existing portfolio, the Company has completed 2,765 value-add unit upgrades at an average cost of $5,811 per unit and achieved an average monthly rental rate increase of $114 per unit, equating to a 23.5% ROI on all unit upgrades leased as of March 31, 2020. The Company has identified approximately 4,611 remaining units within the existing portfolio for value-add upgrades with similar projected economics to the completed renovations. Due to the uncertainty surrounding the COVID-19 impact, the Company has temporarily suspended most interior renovations at this point, with the view that it will evaluate its renovation program at the market and property level as it has more visibility on the economic recovery. The Company has adjusted its forecasts and now expects to complete between 120 and 130 unit renovations in 2020.
Portfolio Activity
The Company completed the following investments:
- Acquired a 100% interest in a 254-unit apartment community located in Phoenix, Arizona, known as Avenue 25. The total purchase price was $56 million, funded in part by a $37 million mortgage loan secured by the property.
- Acquired a 100% interest in a 356-unit apartment community located in Cumming, Georgia, known as Falls at Forsyth. The total purchase price was $83 million, funded in part by the Company’s senior credit facility secured by the property.
- Made additional preferred equity investments in the Strategic Portfolio totaling $8 million into two operating assets with 408-units called Georgetown Crossing and Park on the Square, located in Savannah, Georgia and Pensacola, Florida, respectively. Subsequent to quarter end, the Company made a $4 million preferred equity investment in The Commons located in Jacksonville, Florida, the last property in the portfolio.
- Funded $6 million under existing preferred and mezzanine loan commitments in seven investments.
- Acquired land for $3 million and committed $20 million for the ground lease tenant’s multifamily development in Austin, Texas.
The Company completed the following activities:
- Received $23 million of net proceeds from the sale of the Helios property and $20 million of proceeds from the sale of the Whetstone property.
- Received a $21 million paydown on The Park at Chapel Hill mezzanine loan and an $8 million paydown on the Motif mezzanine loan.
- Pre-COVID-19, entered into sales agreements for the sale of Ashton I & II, Enders Place at Baldwin Park and Marquis at TPC which closed in April 2020 for total sales prices of $160 million.
Balance Sheet
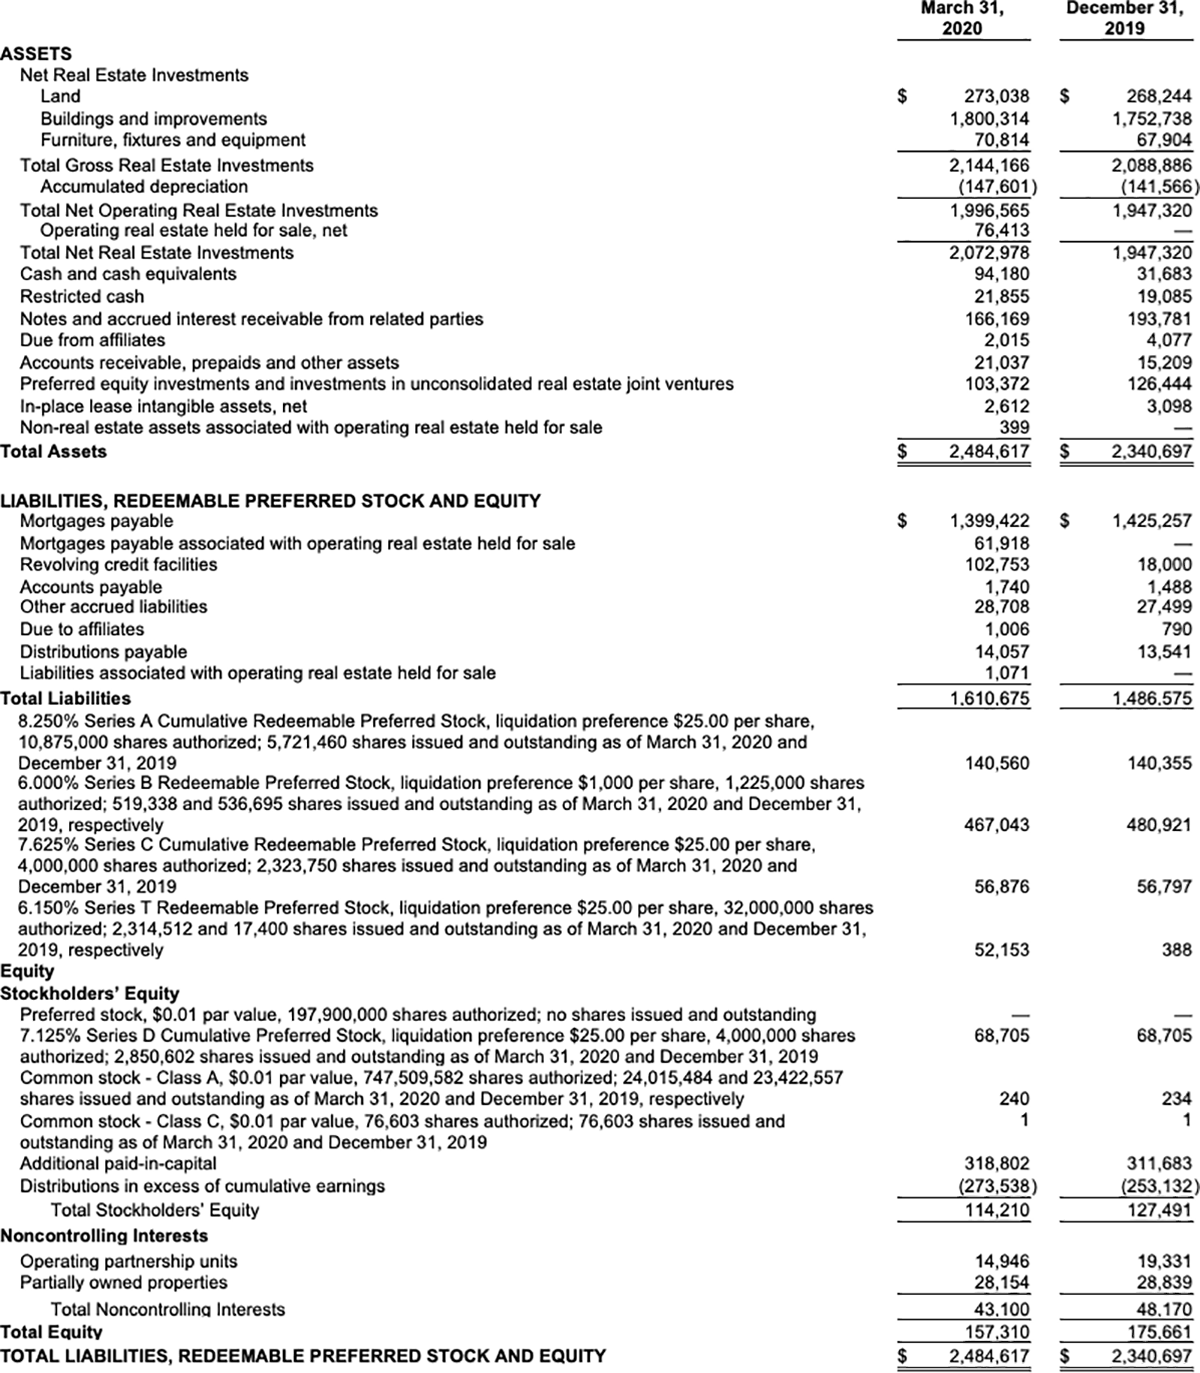
As of March 31, 2020, the Company had $94.2 million of unrestricted cash on its balance sheet, approximately $51.0 million available among its revolving and term credit facilities, and $1.6 billion of indebtedness outstanding.
During the first quarter, the Company raised gross proceeds of approximately $57.4 million through the issuance of 2.3 million shares of Series T Preferred Stock at $25.00 per share. The Series T Preferred Stock continuous offering offers 20,000,000 preferred shares in the primary offering, along with 12,000,000 preferred shares pursuant to a dividend reinvestment plan. The preferred shares are offered at $25.00 per share and pay cumulative monthly dividends at a 6.15% annual rate, along with an annual stock dividend of up to 0.2% for five years.
The Company redeemed 16,986 shares of Series B Preferred Stock representing a stated value of $17.0 million plus accrued and unpaid dividends by issuing 1,442,650 shares of Class A common stock at an average price of $11.79 per share.
The Company repurchased 1,028,293 shares of Class A common stock during the first quarter at an average price of $11.29 per share, for approximately $11.6 million under its $50.0 million share repurchase plan announced in December 2019.
The Company sold 166,873 shares of its Class A common stock at a weighted average price of $12.10 per share, for total proceeds of approximately $2.0 million under its Class A common stock ATM (“At-the-Market”) offering announced in September 2019.
Dividend
The Board of Directors authorized, and the Company declared, a quarterly cash dividend for the first quarter of 2020 equal to a quarterly rate of $0.1625 per share on its Class A and Class C common stock, payable to the stockholders of record as of March 25, 2020, and was paid on April 3, 2020. A portion of each dividend may constitute a return of capital for tax purposes.
The Board of Directors authorized, and the Company declared, a quarterly cash dividend on its 8.250% Series A Cumulative Redeemable Preferred Stock for the first quarter of 2020, in the amount of $0.515625 per share. In addition, the Board of Directors authorized, and the Company declared, a quarterly cash dividend on its 7.625% Series C Cumulative Redeemable Preferred Stock for the first quarter of 2020, in the amount of $0.4765625 per share. Further, the Board of Directors authorized, and the Company declared, a quarterly cash dividend on its 7.125% Series D Cumulative Preferred Stock for the first quarter of 2020, in the amount of $0.4453125 per share. The dividends were payable to the stockholders of record on March 25, 2020, and were paid on April 3, 2020.
On April 14, 2020, the Board of Directors authorized, and the Company declared, a monthly dividend of $5.00 per share of Series B Preferred Stock, payable to the stockholders of record as of April 24, 2020, which was paid in cash on May 5, 2020. On May 9, 2020, the Board of Directors authorized, and the Company declared, a monthly dividend of $5.00 per share of Series B Preferred Stock, payable to the stockholders of record as of May 22, 2020, and June 25, 2020, which will be paid in cash on June 5, 2020 and July 2, 2020, respectively.
On April 14, 2020, the Board of Directors authorized, and the Company declared a monthly dividend of $0.128125 per share of Series T Preferred Stock, prorated on the basis of the actual number of days in the applicable dividend period during which each share was outstanding. Such pro-rated dividends were payable to the stockholders of record as of April 24, 2020, which was paid in cash on May 5, 2020. On May 9, 2020, the Board of Directors authorized, and the Company declared a monthly dividend of $0.128125 per share of Series T Preferred Stock, prorated on the basis of the actual number of days in the applicable dividend period during which each share was outstanding. Such pro-rated dividends are payable to the stockholders of record as of May 22, 2020, and June 25, 2020, which will be paid in cash on June 5, 2020 and July 2, 2020, respectively.
On May 9, 2020, the Board of Directors authorized, and the Company declared, a quarterly cash dividend for the second quarter of 2020 equal to a quarterly rate of $0.1625 per share on its Class A and Class C common stock, payable to the stockholders of record as of June 25, 2020, which will be paid on July 2, 2020. A portion of each dividend may constitute a return of capital for tax purposes.
On May 9, 2020, the Board of Directors authorized, and the Company declared, a quarterly cash dividend on its 8.250% Series A Cumulative Redeemable Preferred Stock for the second quarter of 2020, in the amount of $0.515625 per share. In addition, the Board of Directors authorized, and the Company declared, a quarterly cash dividend on its 7.625% Series C Cumulative Redeemable Preferred Stock for the second quarter of 2020, in the amount of $0.4765625 per share. Further, the Board of Directors authorized, and the Company declared, a quarterly cash dividend on its 7.125% Series D Cumulative Preferred Stock for the second quarter of 2020, in the amount of $0.4453125 per share. The dividends are payable to the stockholders of record as of June 25, 2020, which are payable on July 2, 2020.
2020 Guidance
While the Company’s first quarter 2020 operating results were in line with previously announced guidance, due to inherent uncertainty regarding the economic effects of the COVID-19 pandemic, the Company is withdrawing its full year 2020 guidance which was included in the Company’s February 13, 2020 earnings release.
Conference Call
All interested parties can listen to the live conference call at 11:00 AM ET on Monday, May 11, 2020 by dialing +1 (866) 843-0890 within the U.S., or +1 (412) 317-6597, and requesting the “Bluerock Residential Conference.”
For those who are not available to listen to the live call, the conference call will be available for replay on the Company’s website two hours after the call concludes, and will remain available until June 11, 2020 at http://services.choruscall.com/links/brg200511.html, as well as by dialing +1 (877) 344-7529 in the U.S., or +1 (412) 317-0088 internationally, and requesting conference number 10142897.
The full text of this Earnings Release and additional Supplemental Information is available in the Investor Relations section on the Company’s website at bluerockresidential.com.
About Bluerock Residential Growth REIT, Inc.
Bluerock Residential Growth REIT, Inc. (NYSE American: BRG) is a real estate investment trust that focuses on developing and acquiring a diversified portfolio of institutional-quality highly amenitized live/work/play apartment communities in demographically attractive knowledge economy growth markets to appeal to the renter by choice. The Company’s objective is to generate value through off-market/relationship-based transactions and, at the asset level, through value add improvements to properties and operations. The Company is included in the Russell 2000 and Russell 3000 Indexes. BRG has elected to be taxed as a real estate investment trust (REIT) for U.S. federal income tax purposes.
For more information, please visit the Company’s website at bluerockresidential.com.
Forward Looking Statements
This press release contains forward-looking statements within the meaning of the Private Securities Litigation Reform Act of 1995 and other federal securities laws. These forward-looking statements are based upon the Company’s present expectations, but these statements are not guaranteed to occur. Furthermore, the Company disclaims any obligation to publicly update or revise any forward-looking statement to reflect changes in underlying assumptions or factors, of new information, data or methods, future events or other changes. Investors should not place undue reliance upon forward-looking statements. Although the Company believes that the expectations reflected in these forward-looking statements are based on reasonable assumptions, the Company’s actual results and performance could differ materially from those set forth in these forward-looking statements due to numerous factors. Currently, one of the most significant factors is the potential adverse effect of the COVID-19 pandemic on the financial condition, results of operations, cash flows and performance of the Company and its tenants, partners and employees, as well as the real estate market and the global economy and financial markets. The extent to which COVID-19 impacts the Company and its tenants, partners and employees will depend on future developments, which are highly uncertain and cannot be predicted with confidence, including the scope, severity and duration of the pandemic, the actions taken to contain the pandemic or mitigate its impact (including governmental actions that may vary by jurisdiction, such as mandated business closing; stay-at-home orders; limits on group activity; and actions to protect residential tenants from eviction), and the direct and indirect economic effects of the pandemic and containment measures, including national and local employment rates and the corresponding impact on the Company’s tenants’ ability to pay their rent on time or at all, among others. For further discussion of the factors that could affect outcomes, please refer to the risk factors set forth in Item 1A of the Company’s Annual Report on Form 10-K filed by the Company with the U.S. Securities and Exchange Commission (“SEC”) on February 24, 2020, and subsequent filings by the Company with the SEC. We claim the safe harbor protection for forward looking statements contained in the Private Securities Litigation Reform Act of 1995.
Portfolio Summary
The following is a summary of our operating real estate and mezzanine/preferred/ground lease investments as of March 31, 2020:
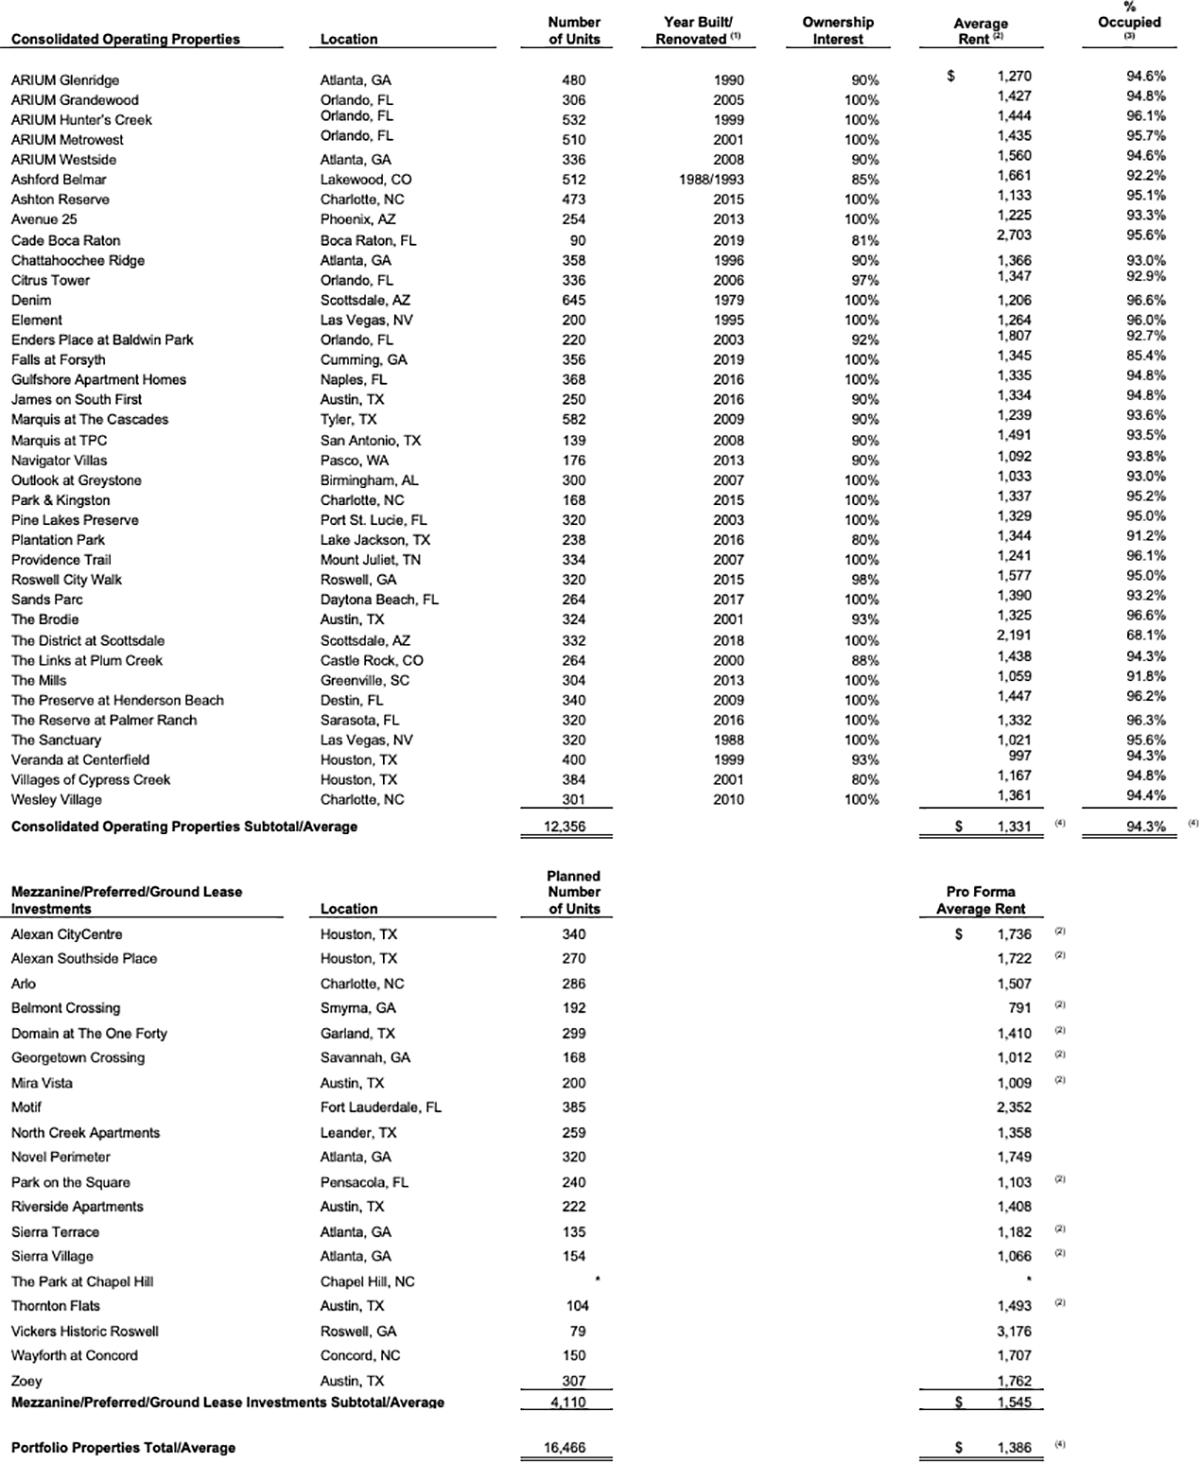
(1) Represents date of last significant renovation or year built if there were no renovations.
(2) Represents the average effective monthly rent per occupied unit for the three months ended March 31, 2020.
(3) Percent occupied is calculated as (i) the number of units occupied as of March 31, 2020, divided by (ii) total number of units, expressed as a percentage.
(4) Excludes The District at Scottsdale which is in lease-up.
* The development is in the planning phase; project specifications are in process.
Consolidated Statement of Operations
For the Three Months Ended March 31, 2020 and 2019
(Unaudited and dollars in thousands except for share and per share data)
Consolidated Balance Sheets
First Quarter 2020
(Unaudited and dollars in thousands except for share and per share amounts)
Non-GAAP Financial Measures
The foregoing supplemental financial data includes certain non-GAAP financial measures that we believe are helpful in understanding our business and performance, as further described below. Our definition and calculation of these non-GAAP financial measures may differ from those of other REITs, and may, therefore, not be comparable.
Funds from Operations and Core Funds from Operations
We believe that funds from operations (“FFO”), as defined by the National Association of Real Estate Investment Trusts (“NAREIT”) and core funds from operations (“CFFO) are important non-GAAP supplemental measures of operating performance for a REIT.
FFO attributable to common shares and units is a non-GAAP financial measure that is widely recognized as a measure of REIT operating performance. We consider FFO to be an appropriate supplemental measure of our operating performance as it is based on a net income analysis of property portfolio performance that excludes non-cash items such as depreciation. The historical accounting convention used for real estate assets requires straight-line depreciation of buildings and improvements, which implies that the value of real estate assets diminishes predictably over time. Since real estate values historically rise and fall with market conditions, presentations of operating results for a REIT, using historical accounting for depreciation, could be less informative. We define FFO, consistent with the NAREIT definition, as net income, computed in accordance with GAAP, excluding gains or losses on sales of depreciable real estate property, plus depreciation and amortization of real estate assets, plus impairment write-downs of depreciable real estate, and after adjustments for unconsolidated partnerships and joint ventures. Adjustments for unconsolidated partnerships and joint ventures will be calculated to reflect FFO on the same basis.
CFFO makes certain adjustments to FFO, removing the effect of items that do not reflect ongoing property operations such as acquisition expenses, non-cash interest, unrealized gains and losses on derivatives, losses on extinguishment of debt and debt modification costs (includes prepayment penalties incurred and the write-off of unamortized deferred financing costs and fair market value adjustments of assumed debt), one-time weather-related costs, gain or losses on sales of non-depreciable real estate property, shareholder activism, stock compensation expense and preferred stock accretion. Commencing January 1, 2020, we did not deduct the accrued portion of the preferred income on our preferred equity investments from FFO to determine CFFO as the income is deemed fully collectible under the terms of the agreement. The amount totaled $0.4 million for the three months ended March 31, 2020. We believe that CFFO is helpful to investors as a supplemental performance measure because it excludes the effects of certain items which can create significant earnings volatility, but which do not directly relate to our core recurring property operations. As a result, we believe that CFFO can help facilitate comparisons of operating performance between periods and provides a more meaningful predictor of future earnings potential.
Our calculation of CFFO differs from the methodology used for calculating CFFO by certain other REITs and, accordingly, our CFFO may not be comparable to CFFO reported by other REITs. Our management utilizes FFO and CFFO as measures of our operating performance after adjustment for certain non-cash items, such as depreciation and amortization expenses, and acquisition and pursuit costs that are required by GAAP to be expensed but may not necessarily be indicative of current operating performance and that may not accurately compare our operating performance between periods. Furthermore, although FFO and CFFO and other supplemental performance measures are defined in various ways throughout the REIT industry, we also believe that FFO and CFFO may provide us and our stockholders with an additional useful measure to compare our financial performance to certain other REITs.
Neither FFO nor CFFO is equivalent to net income, including net income attributable to common stockholders, or cash generated from operating activities determined in accordance with GAAP. Furthermore, FFO and CFFO do not represent amounts available for management’s discretionary use because of needed capital replacement or expansion, debt service obligations or other commitments or uncertainties. Neither FFO nor CFFO should be considered as an alternative to net income, including net income attributable to common stockholders, as an indicator of our operating performance or as an alternative to cash flow from operating activities as a measure of our liquidity.
We have acquired nine operating properties and made seven property investments through preferred equity interests or mezzanine loans and sold nine operating properties subsequent to March 31, 2019. The results presented in the table below are not directly comparable and should not be considered an indication of our future operating performance.
The table below reconciles our calculations of FFO and CFFO to net loss, the most directly comparable GAAP financial measure, for the three months ended March 31, 2020 and 2019 (in thousands, except per share amounts):
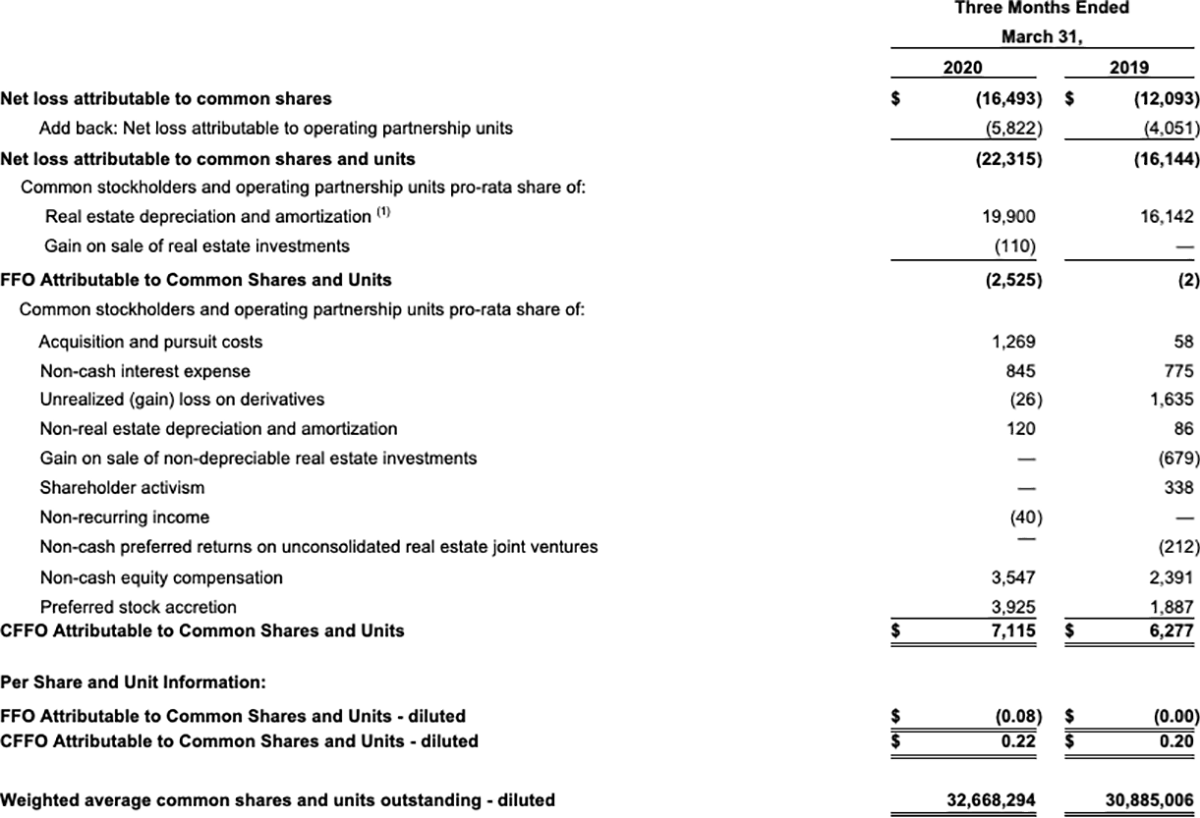
(1) The real estate depreciation and amortization amount includes our share of consolidated real estate-related depreciation and amortization of intangibles, less amounts attributable to noncontrolling interests for partially owned properties, and our similar estimated share of unconsolidated depreciation and amortization, which is included in earnings of our unconsolidated real estate joint venture investments.
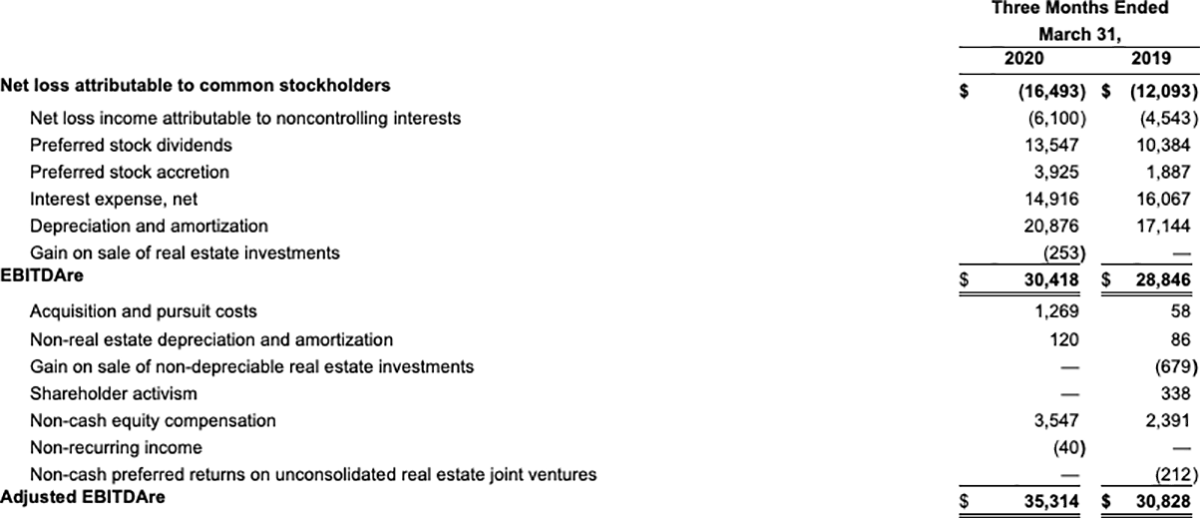
Earnings Before Interest, Taxes, Depreciation and Amortization for Real Estate (“EBITDAre”)
NAREIT defines earnings before interest, taxes, depreciation and amortization for real estate (“EBITDAre”) (September 2017 White Paper) as net income (loss), computed in accordance with GAAP, before interest expense, income taxes, depreciation and amortization expense, and further adjusted for gains and losses from sales of depreciated operating properties, and impairment write-downs of depreciated operating properties.
We consider EBITDAre to be an appropriate supplemental measure of our performance because it eliminates depreciation, income taxes, interest and non-recurring items, which permits investors to view income from operations unobscured by non-cash items such as depreciation, amortization, the cost of debt or non-recurring items.
Adjusted EBITDAre represents EBITDAre further adjusted for non-comparable items and it is not intended to be a measure of free cash flow for our management’s discretionary use, as it does not consider certain cash requirements such as income tax payments, debt service requirements, capital expenditures and other fixed charges.
EBITDAre and Adjusted EBITDAre are not recognized measurements under GAAP. Because not all companies use identical calculations, our presentation of EBITDAre and Adjusted EBITDAre may not be comparable to similarly titled measures of other companies.
Below is a reconciliation of net loss attributable to common stockholders to EBITDAre (unaudited and dollars in thousands).
Same Store Properties
Same store properties are conventional multifamily residential apartments which were owned and operational for the entire periods presented, including each comparative period.
Property Net Operating Income (“Property NOI”)
We believe that net operating income, or NOI, is a useful measure of our operating performance. We define NOI as total property revenues less total property operating expenses, excluding depreciation and amortization and interest. Other REITs may use different methodologies for calculating NOI, and accordingly, our NOI may not be comparable to other REITs. We believe that this measure provides an operating perspective not immediately apparent from GAAP operating income or net income. We use NOI to evaluate our performance on a same store and non-same store basis; NOI measures the core operations of property performance by excluding corporate level expenses and other items not related to property operating performance and captures trends in rental housing and property operating expenses. However, NOI should only be used as a supplemental measure of our financial performance.
The following table reflects net loss attributable to common stockholders together with a reconciliation to NOI and to same store and non-same store contributions to consolidated NOI, as computed in accordance with GAAP for the periods presented (unaudited and amounts in thousands):
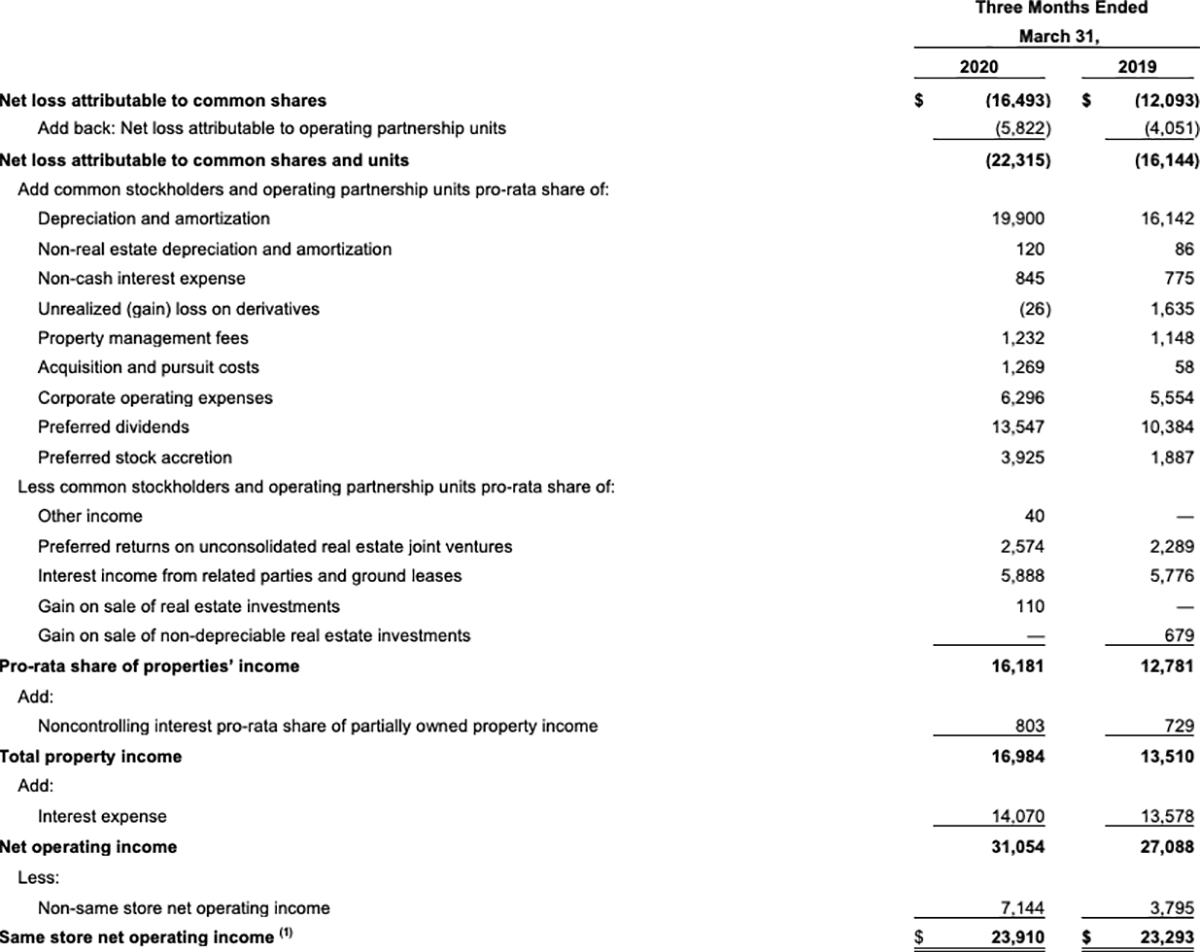
(1) Same store portfolio for the three months ended March 31, 2020 consists of 27 properties, which represent 9,291 units.