Bluerock Residential Growth REIT Announces Second Quarter 2017 Results
New York, NY (August 8, 2017) – Bluerock Residential Growth REIT, Inc. (NYSE MKT: BRG) (“the Company”) announced today its financial results for the quarter ended June 30, 2017.
Highlights
- Total revenues grew 47% to $27.0 million for the quarter from $18.4 million for the prior year quarter primarily as a result of significant investment activity in the past year, offset by the sales of four properties in 2017 and one in 2016.
- Net income attributable to common stockholders for the second quarter of 2017 was $0.67 per share, as compared to net loss attributable to common shareholders of $(0.24) per share in the prior year period. Net income (loss) attributable to common stockholders included non-cash expenses of $0.66 per share in the second quarter of 2017 vs. $0.45 per share for the prior year period.
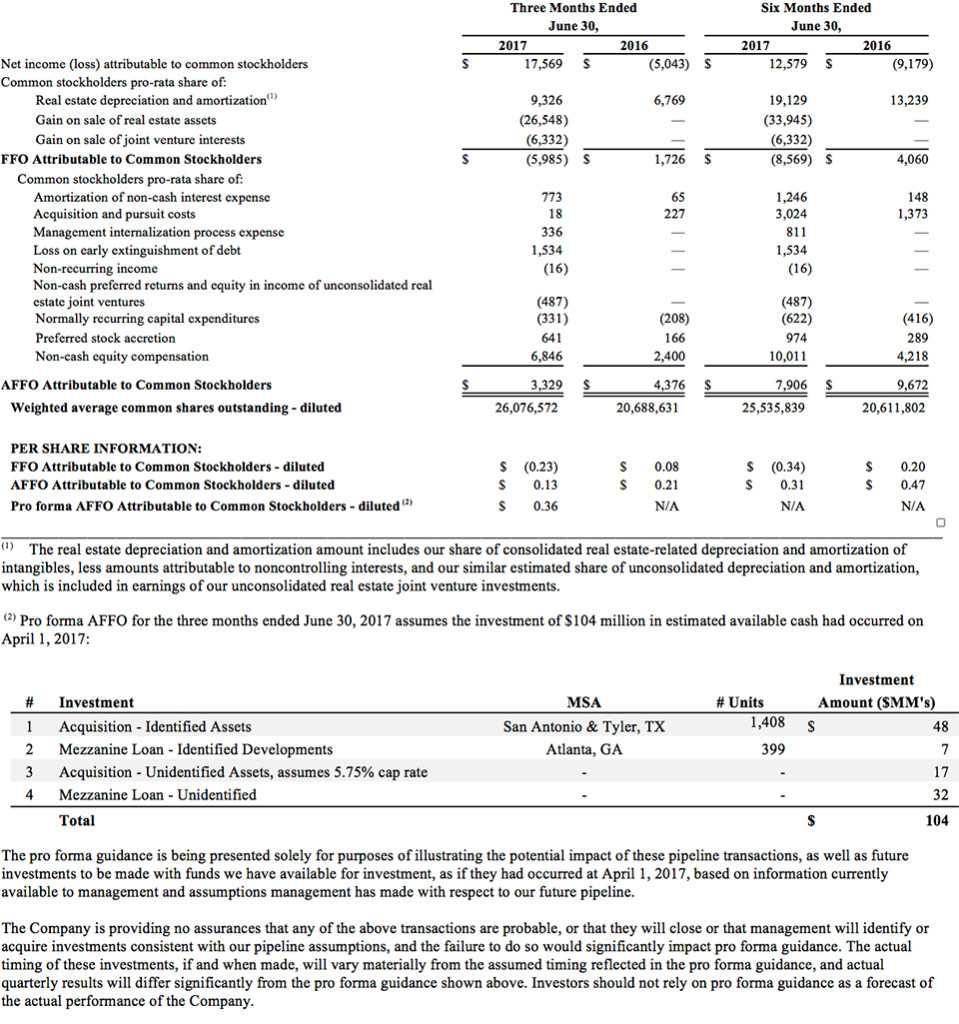
- Adjusted funds from operations attributable to common stockholders (“AFFO”) was $3.3 million for the quarter compared to $4.4 million for the prior year quarter.
- AFFO per share is $0.13 for the second quarter of 2017 as compared to $0.21 for the second quarter of 2016, and exceeded guidance of $0.01 – $0.02.
- Pro forma AFFO per share of $0.36 for the second quarter exceeded pro forma guidance of $0.26 to $0.28 per share.
- The Company paid the full amount of the second quarter’s base management fees in LTIP Units in lieu of cash payment. This favorably impacted AFFO per share and pro forma AFFO per share by $0.10 and $0.09, respectively.
- Property Net Operating Income (NOI) grew 30% to $14.3 million for the quarter, from $11.0 million in the prior year quarter.
- Property NOI margins were 57.3% of revenue for the quarter, compared to 59.8% of revenue in the prior year quarter. Property NOI margins were impacted by the sales of more stabilized assets with proceeds being recycled into replacement properties with higher growth opportunities, which require time to realize margin improvement.
- Same store NOI increased 2.3% for the quarter, as compared to the prior year quarter. The sales of Fox Hill, Lansbrook Village and MDA Apartments during the second quarter have impacted the same store comparisons since the first quarter of 2017.
- Consolidated real estate investments, at cost, increased 10% to $1.1 billion at June 30, 2017 from $1.0 billion at December 31, 2016.
- The Company invested in a portfolio of five operating properties totaling 1,408 units for a total purchase price of approximately $188.9 million during the second quarter.
- The Company declared a monthly dividend for July 2017 of $0.096666 per share on the Company’s Class A common stock.
- The Company sold 50,501 shares of Series B preferred stock with associated warrants at a public offering price of $1,000 per unit, for gross proceeds of approximately $50.5 million during the second quarter, an increase in gross proceeds of 114% over the first quarter.
Management Commentary
“We are pleased to report the acquisition of a portfolio of five operating properties totaling 1,408 units for approximately $189 million, continued momentum in the Series B preferred continuous offering raise with second quarter gross proceeds of over $50 million and the recycling of capital through the disposition of interests in three properties at significant gains during the second quarter,” said Ramin Kamfar, the Company’s Chairman and CEO. “Importantly, on August 4, 2017, we also signed definitive agreements to effect the Company’s internalization of its external management function, which will be subject to a vote of our common stockholders at our upcoming annual meeting of stockholders.”
Second Quarter Acquisition and Disposition Activity
- On April 26, 2017, the Company sold its interest in the Lansbrook Village apartments in Palm Harbor, Florida at a total sale price of approximately $82.4 million, recognized a pro rata gain of $16.1 million, with net proceeds of approximately $19.1 million to the Company, generating an internal rate of return of 25% on BRG’s equity investment in the project, for an equity multiple of 1.71x.
- On May 24, 2017, the Company sold its interest in the Fox Hill apartments in Austin, Texas at a total sale price of approximately $46.5 million, recognized a pro rata gain of $10.3 million, with net proceeds of approximately $16.4 million to the Company, generating an internal rate of return of 26% on BRG’s equity investment in the project, for an equity multiple of 1.62x.
- On June 9, 2017, the Company acquired a 90% investment in a 1,408-unit five-property portfolio of multifamily communities located in San Antonio and Tyler, Texas. The total purchase price of approximately $188.9 million includes the assumption of approximately $146.4 million of existing mortgage debt.
- On June 30, 2017, the Company sold its interest in the MDA apartments in Chicago, Illinois at a total sale price of approximately $18.3 million, recognized a pro rata gain of $6.4 million, with net proceeds of approximately $11.0 million to the Company, generating an internal rate of return of 22% on BRG’s equity investment in the project, for an equity multiple of 2.23x.
Pending Investments at June 30, 2017
- The Company has an agreement which entitles the Company to make a 80% investment in a 384-unit apartment community located in Houston, Texas, known as Villages at Cypress Creek, subject to certain conditions. The total purchase price is expected to be approximately $40.7 million.
- The Company has an agreement which entitles the Company to make a 98% investment in a 336-unit apartment community located in Orlando, Florida, known as Citrus Tower, subject to certain conditions. The total purchase price is expected to be approximately $55.3 million.
Second Quarter 2017 Financial Results
Net income attributable to common stockholders for the second quarter of 2017 was $17.6 million, compared to a net loss of $5.0 million in the prior year period. The change was primarily driven by positive increases in property NOI of $3.3 million, interest income of $2.1 million and a gain on sale of real estate investments of $43.8 million, offset by increases in management fees of $4.7 million, depreciation and amortization expense of $2.6 million, interest expense of $3.2 million, loss on extinguishment of debt of $1.6 million, preferred stock dividends and accretion of $3.8 million and non-controlling income allocation of $10.2 million.
AFFO for the second quarter of 2017 was $3.3 million, or $0.13 per diluted share, compared to $4.4 million, or $0.21 per share in the prior year period. AFFO was primarily impacted by increases in property NOI of $3.3 million arising from significant investment activity offset by sales of properties, interest income of $2.1 million and offset by interest expense of $2.5 million and preferred stock dividends of $3.4 million.
Same Store Portfolio Performance
- Same store NOI for the second quarter of 2017 increased by 2.3% from the same period in the prior year. There was a 2.4% increase in same store property revenues compared to the same prior year period, primarily attributable to a 3.5% increase in average rental rates offset by a 52 basis point decrease in average occupancy. Same store expenses increased 2.6% due to an increase in repair and maintenance across the portfolio.
- The sales of Fox Hill, Lansbrook Village and MDA Apartments during the second quarter have impacted the same store comparisons since the first quarter of 2017.
Management Internalization
On August 4, 2017, the Company announced that it had entered into definitive agreements providing for the Company’s internalization of the external management function currently provided by the Manager and the direct employment of the Manager’s existing management team and certain other employees. The internalization consideration will be calculated pursuant to a formula established in the Management Agreement at the time of the Company’s initial public offering in April 2014 and is expected to be approximately $41-$42 million. To further align the interests of the Company’s management team with those of the Company’s stockholders, 99.9% of the consideration will be paid in equity, comprised of units of limited partnership interest (“OP Units”) in the Company’s operating partnership, and shares of Class C Common Stock, which are being issued to provide the recipients with a voting franchise commensurate with their economic interest in the OP Units. Upon closing of the internalization, which is expected to close in the fourth quarter of 2017, the Company will become a self-managed real estate investment trust. The proposed transaction was unanimously approved by the Special Committee of independent directors and the Company’s full board of directors, but remains subject to approval of the issuances of equity by a majority of disinterested stockholders voting at the Company’s annual meeting of stockholders and other customary closing conditions.
Dividend Details
On July 10, 2017, our board of directors authorized, and we declared, a monthly dividend for July 2017 of $0.096666 per share on our Class A common stock, payable to the stockholders of record as of July 25, 2017, which was paid in cash on August 4, 2017. Holders of OP and LTIP Units are entitled to receive “distribution equivalents” at the same time as dividends are paid to holders of our Class A common stock. A portion of each dividend may constitute a return of capital for tax purposes. There is no assurance that we will continue to declare dividends or at this rate.
On August 4, 2017, we announced that our board of directors has initiated, in conjunction with a financial advisor, a review of the appropriate Company’s dividend policy for the Company’s Class A Common stock. The board’s evaluation will consider factors including, but not limited to, achieving a sustainable dividend covered by current recurring AFFO (vs. pro forma AFFO), multifamily and small cap peer ratios, providing financial flexibility for the Company, and achieving an appropriate balance between the retention of capital to invest and grow net asset value, and the importance of current distributions. The board is expected to complete its review of the dividend policy for the Company’s Class A Common Stock in the fourth quarter of 2017.
On July 10, 2017, our board of directors authorized, and we declared, a monthly dividend of $5.00 per share of Series B preferred stock, payable to the stockholders of record as of July 25, 2017, which was paid in cash on August 4, 2017, and as of August 25, 2017, and September 25, 2017, which will be paid in cash on September 5, 2017 and October 5, 2017, respectively.
The board’s review of dividend policy will address the dividend policy for the Company’s Class A Common Stock only. The terms of each series of the Company’s issued and outstanding preferred stock provide for fixed annual dividend rates, and are not subject to adjustment at the board’s discretion.
Q3 2017 Outlook
For the third quarter of 2017, the Company anticipates AFFO in the range of ($0.03) to ($0.02) per share, and $0.25 to $0.27 per share on a pro forma basis. For assumptions underlying earnings guidance, please see page 29 of Company’s Q2 2017 Earnings Supplement available under Investor Relations on the Company’s website (www.bluerockresidential.com). Pro forma AFFO is used for illustrative purposes only, is hypothetical and does not represent historical performance or management’s estimates or projections for future performance.
Conference Call
All interested parties can listen to the live conference call at 11:00 AM ET on Tuesday, August 8, 2017 by dialing +1 (866) 843-0890 within the U.S., or +1 (412) 317-6597, and requesting the “Bluerock Residential Conference.”
For those who are not available to listen to the live call, the conference call will be available for replay on the Company’s website two hours after the call concludes, and will remain available until September 8, 2017 at http://services.choruscall.com/links/brg170808.html, as well as by dialing +1 (877) 344-7529 in the U.S., or +1 (412) 317-0088 internationally, and requesting conference number 10111174.
The full text of this Earnings Release and additional Supplemental Information is available in the Investor Relations section on the Company’s website at https://www.bluerockresidential.com.
About Bluerock Residential Growth REIT, Inc.
Bluerock Residential Growth REIT, Inc. (NYSE MKT: BRG) is a real estate investment trust that focuses on acquiring a diversified portfolio of Class A institutional-quality apartment properties in demographically attractive growth markets to appeal to the renter by choice. The Company’s objective is to generate value through off-market/relationship-based transactions and, at the asset level, through improvements to operations and properties. BRG generally invests with strategic regional partners, including some of the best-regarded private owner-operators in the United States, making it possible to operate as a local sharpshooter in each of its markets while enhancing off-market sourcing capabilities. The Company is included in the Russell 2000 and Russell 3000 Indexes. BRG has elected to be taxed as a real estate investment trust (REIT) for U.S. federal income tax purposes.
For more information, please visit the Company’s website at www.bluerockresidential.com.
Forward Looking Statements
This press release contains forward-looking statements within the meaning of the Private Securities Litigation Reform Act of 1995 and other federal securities laws. These forward-looking statements are based upon the Company’s present expectations, but these statements are not guaranteed to occur, including, without limitation, with respect to the completion of the proposed internalization on the terms described or at all and the expected benefits of the proposed internalization. Among others, the following uncertainties and other factors could cause actual results to differ from those set forth in the forward-looking statements: the failure to receive, on a timely basis or otherwise, the required approval by the Company’s stockholders, governmental or regulatory agencies and third parties; the risk that a condition to closing of the proposed internalization may not be satisfied; and the Company’s ability to consummate the proposed internalization. Furthermore, the Company disclaims any obligation to publicly update or revise any forward-looking statement to reflect changes in underlying assumptions or factors, of new information, data or methods, future events or other changes. Investors should not place undue reliance upon forward-looking statements. For further discussion of the factors that could affect outcomes, please refer to the risk factors set forth in Item 1A of the Company’s Annual Report on Form 10-K filed by the Company with the U.S. Securities and Exchange Commission (“SEC”) on February 22, 2017, and subsequent filings by the Company with the SEC. We claim the safe harbor protection for forward looking statements contained in the Private Securities Litigation Reform Act of 1995.
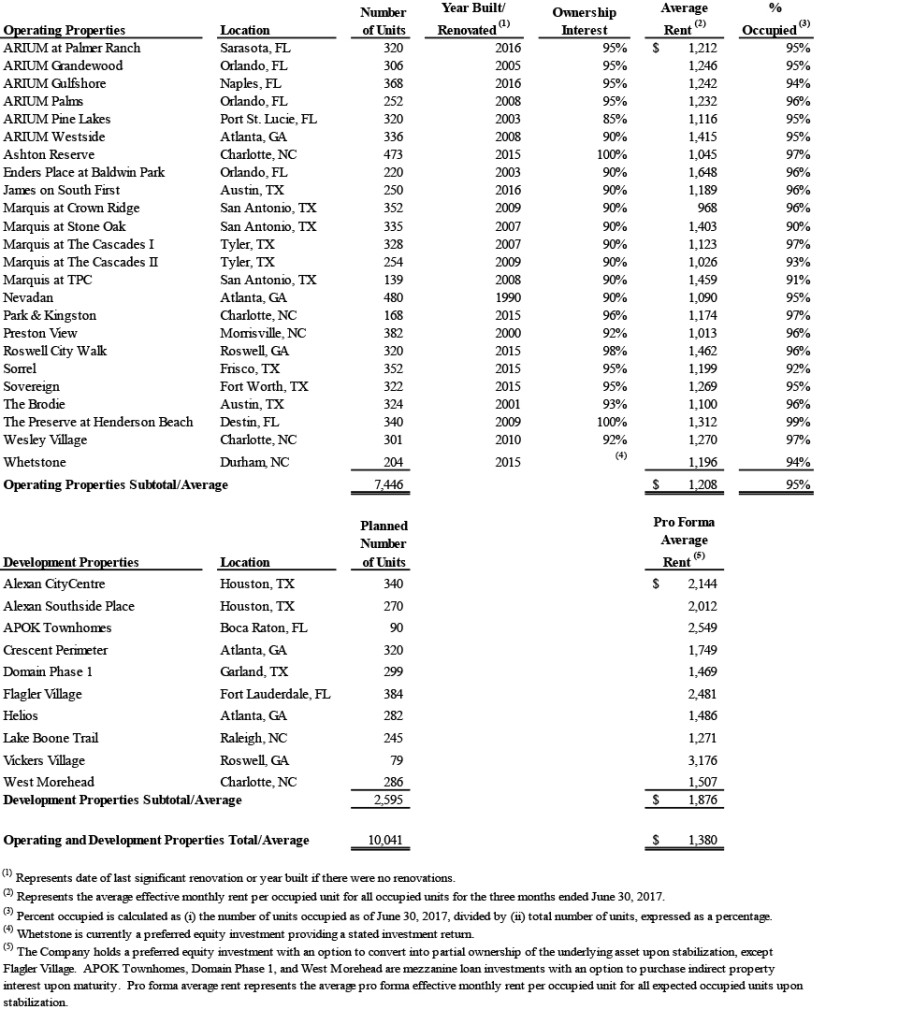
Portfolio Summary
The following is a summary of our operating real estate and development properties as of June 30, 2017:
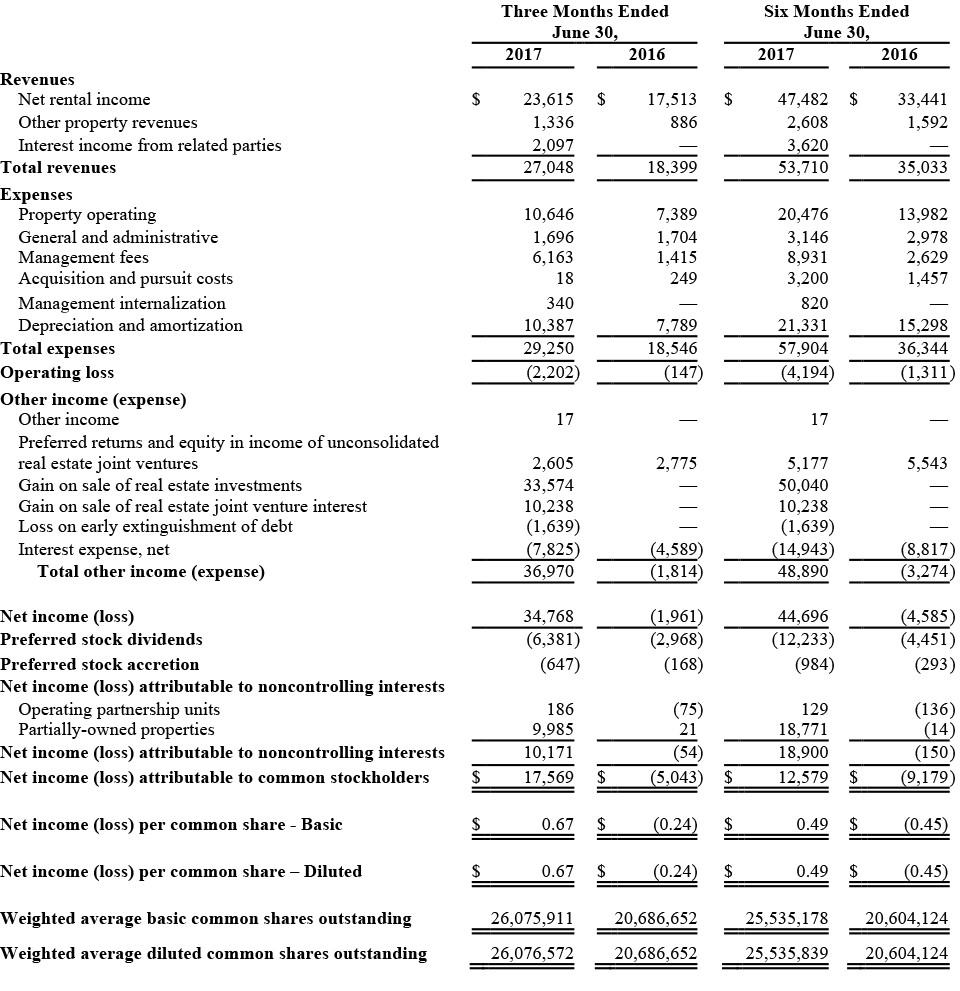
Consolidated Statement of Operations
For the Three and Six Months Ended June 30, 2017 and 2016
(Unaudited and dollars in thousands except for share and per share data)
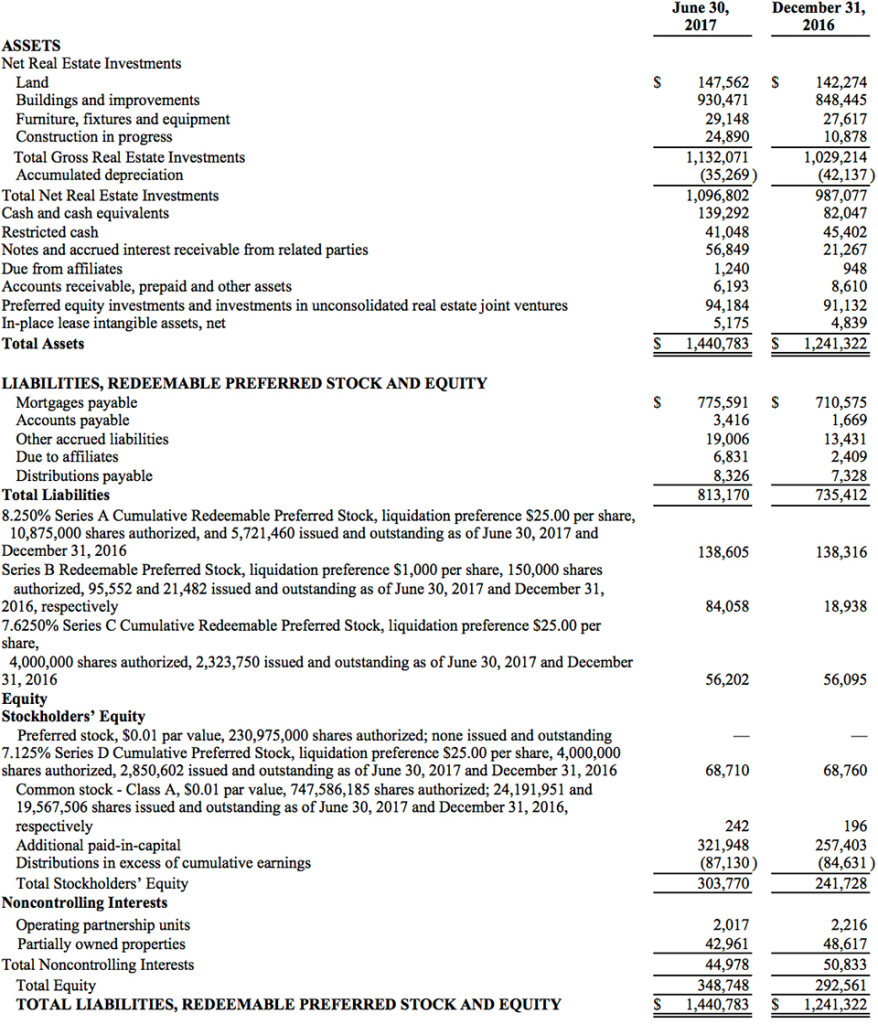
Consolidated Balance Sheets
Second Quarter 2017
(Unaudited and dollars in thousands except for share and per share amounts)
Non-GAAP Financial Measures
The foregoing supplemental financial data includes certain non-GAAP financial measures that we believe are helpful in understanding our business and performance, as further described below. Our definition and calculation of these non-GAAP financial measures may differ from those of other REITs, and may, therefore, not be comparable.
Funds from Operations and Adjusted Funds from Operations
Funds from operations attributable to common stockholders (“FFO”) is a non-GAAP financial measure that is widely recognized as a measure of REIT operating performance. We consider FFO to be an appropriate supplemental measure of our operating performance as it is based on a net income analysis of property portfolio performance that excludes non-cash items such as depreciation. The historical accounting convention used for real estate assets requires straight-line depreciation of buildings and improvements, which implies that the value of real estate assets diminishes predictably over time. Since real estate values historically rise and fall with market conditions, presentations of operating results for a REIT, using historical accounting for depreciation, could be less informative. We define FFO, consistent with the National Association of Real Estate Investment Trusts, or (“NAREIT’s”) definition, as net income, computed in accordance with GAAP, excluding gains (or losses) from sales of property, plus depreciation and amortization of real estate assets, plus impairment write-downs of depreciable real estate, and after adjustments for unconsolidated partnerships and joint ventures. Adjustments for unconsolidated partnerships and joint ventures will be calculated to reflect FFO on the same basis.
In addition to FFO, we use adjusted funds from operations attributable to common stockholders (“AFFO”). AFFO is a computation made by analysts and investors to measure a real estate company’s operating performance by removing the effect of items that do not reflect ongoing property operations. To calculate AFFO, we further adjust FFO by adding back certain items that are not added to net income in NAREIT’s definition of FFO, such as acquisition and pursuit costs, equity based compensation expenses, and any other non-recurring or non-cash expenses, which are costs that do not relate to the operating performance of our properties, and subtracting recurring capital expenditures (and when calculating the quarterly incentive fee payable to our Manager only, we further adjust FFO to include any realized gains or losses on our real estate investments).
Our calculation of AFFO differs from the methodology used for calculating AFFO by certain other REITs and, accordingly, our AFFO may not be comparable to AFFO reported by other REITs. Our management utilizes FFO and AFFO as measures of our operating performance after adjustment for certain non-cash items, such as depreciation and amortization expenses, and acquisition and pursuit costs that are required by GAAP to be expensed but may not necessarily be indicative of current operating performance and that may not accurately compare our operating performance between periods. Furthermore, although FFO, AFFO and other supplemental performance measures are defined in various ways throughout the REIT industry, we also believe that FFO and AFFO may provide us and our stockholders with an additional useful measure to compare our financial performance to certain other REITs. We also use AFFO for purposes of determining the quarterly incentive fee, if any, payable to our Manager.
Neither FFO nor AFFO is equivalent to net income, including net income attributable to common stockholders, or cash generated from operating activities determined in accordance with GAAP. Furthermore, FFO and AFFO do not represent amounts available for management’s discretionary use because of needed capital replacement or expansion, debt service obligations or other commitments or uncertainties. Neither FFO nor AFFO should be considered as an alternative to net income, including net income attributable to common stockholders, as an indicator of our operating performance or as an alternative to cash flow from operating activities as a measure of our liquidity.
We have acquired interests in thirteen additional operating properties and three development investments and sold six properties subsequent to June 30, 2016. The results presented in the table below are not directly comparable and should not be considered an indication of our future operating performance.
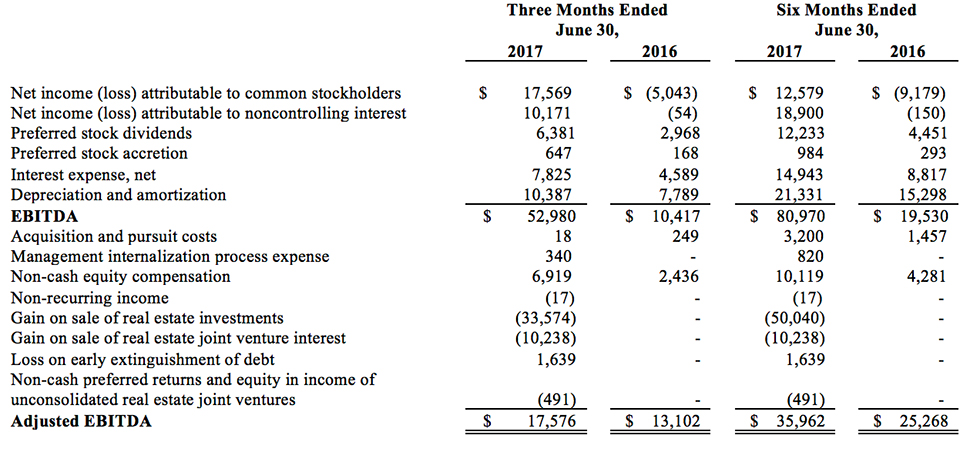
Earnings Before Interest, Income Taxes, Depreciation and Amortization (“EBITDA”)
EBITDA is defined as earnings before interest, income taxes, depreciation and amortization, calculated on a consolidated basis. We consider EBITDA to be an appropriate supplemental measure of our performance because it eliminates depreciation, income taxes, interest and non-recurring items, which permits investors to view income from operations unobscured by non-cash items such as depreciation, amortization, the cost of debt or non-recurring items. Below is a reconciliation of net income (loss) attributable to common stockholders to EBITDA (unaudited and dollars in thousands).
Recurring Capital Expenditures
We define recurring capital expenditures as expenditures that are incurred at every property and exclude development, investment, revenue enhancing and non-recurring capital expenditures.
Non-Recurring Capital Expenditures
We define non-recurring capital expenditures as expenditures for significant projects that upgrade units or common areas and projects that are revenue enhancing.
Same Store Properties
Same store properties are conventional multifamily residential apartments which were owned and operational for the entire periods presented, including each comparative period.
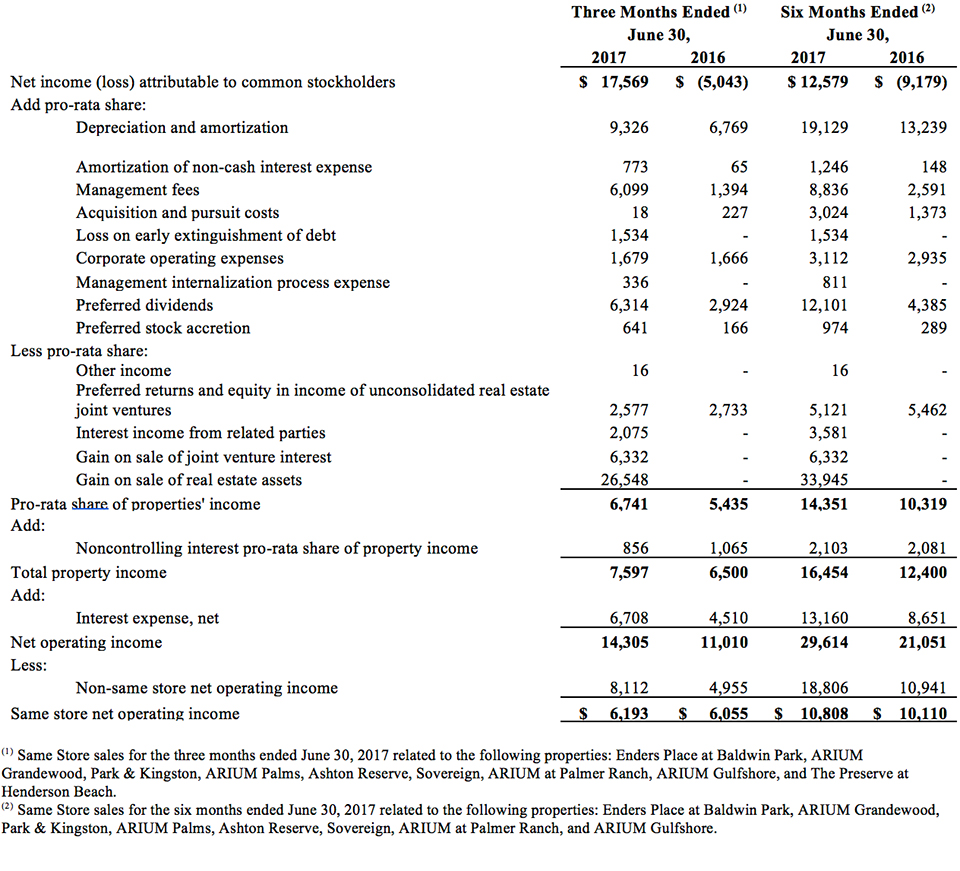
Property Net Operating Income (“Property NOI”)
We believe that net operating income, or NOI, is a useful measure of our operating performance. We define NOI as total property revenues less total property operating expenses, excluding depreciation and amortization and interest. Other REITs may use different methodologies for calculating NOI, and accordingly, our NOI may not be comparable to other REITs. We believe that this measure provides an operating perspective not immediately apparent from GAAP operating income or net income. We use NOI to evaluate our performance on a same store and non-same store basis because NOI measures the core operations of property performance by excluding corporate level expenses and other items not related to property operating performance and captures trends in rental housing and property operating expenses. However, NOI should only be used as an alternative measure of our financial performance.
The following table reflects net income (loss) attributable to common stockholders together with a reconciliation to NOI and to same store and non-same store contributions to consolidated NOI, as computed in accordance with GAAP for the periods presented (unaudited and amounts in thousands):