Bluerock Residential Growth REIT Announces Second Quarter 2021 Results
Quarterly Portfolio Lease Rate Growth of 10.3%
July Portfolio Lease Rate Growth of 15.3%
Same Store Rental Revenues Increased 6.4%
New York, NY (August 5, 2021) – Bluerock Residential Growth REIT, Inc. (NYSE American: BRG) (“the Company”), an owner of highly amenitized multifamily apartment communities, announced today its financial results for the quarter ended June 30, 2021.
“We are very pleased with our operating results led by rapid acceleration of rent growth throughout the quarter, demonstrating the high quality and favorable locations of our communities,” said Ramin Kamfar, Company Chairman and CEO. “In addition, as anticipated in our 2021 guidance, our investment pace increased in the second quarter, including our first investments in single family homes. Our renovation pace also returned to pre-COVID levels, as we delivered almost 250 unit upgrades, with an average ROI of 24%. We are continuing to effectively source attractive investment opportunities and accretively put our capital to work.”
Second Quarter Highlights
Financial Results
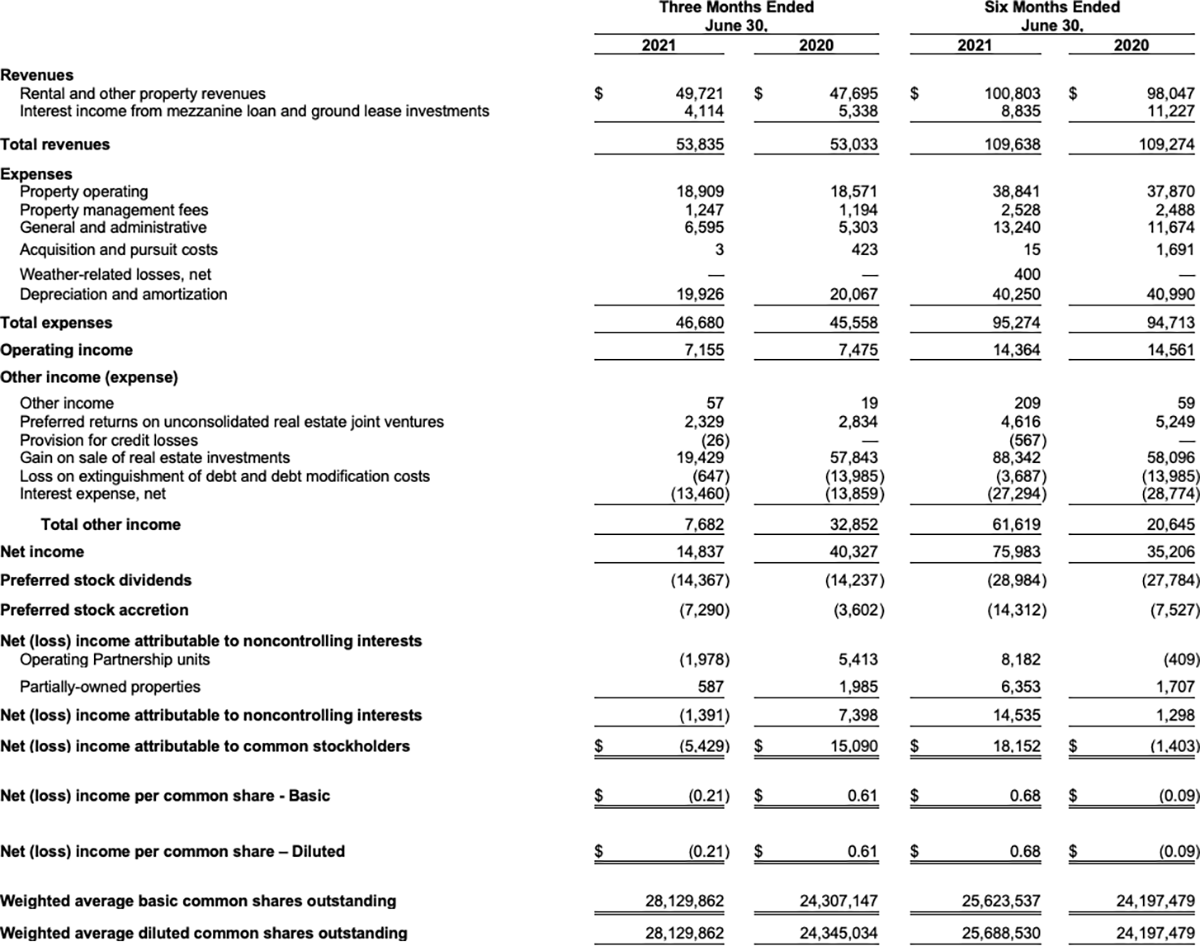
- Net loss attributable to common stockholders for the second quarter of 2021 was ($5.4) million or ($0.21) per diluted share, as compared to net income attributable to common stockholders of $15.1 million or $0.61 per diluted share in the prior year period.
- Core funds from operations attributable to common stockholders and unit holders (“CFFO”) was $6.0 million, or $0.16 per diluted share, compared to $5.1 million, or $0.15 per diluted share, in the prior year period. This year’s results continue to be impacted by additional capital on the balance sheet.
Portfolio Performance
- Rental revenues grew 4.2% to $49.7 million from $47.7 million in the prior year period.
- Property Net Operating Income (“NOI”) increased 5.8% to $30.8 million from $29.1 million in the prior year period.
- Same store revenues grew 6.4% and same store NOI increased 6.5%, as compared to the prior year period.
- Blended lease rate growth was 10.3%, up 680 basis points on a sequential quarter-over-quarter basis.
- June 2021 average lease growth accelerated to 12.0%, with renewals at 6.5% and new leases at 17.9%. Average lease growth accelerated to 15.3% in July.
- Portfolio occupancy was 96.2% at June 30, 2021, up 90 basis points from the prior year.
- Property operating margins improved 90 basis points to 62.0% compared to 61.1% in the prior year period.
- Same store average rent increased 3.0% and same store average occupancy expanded 80 basis points, as compared to the prior year period.
Portfolio Activity
- Consolidated real estate investments, at cost, were approximately $2.2 billion.
- Acquired three operating properties totaling 506 units for $118 million.
- Sold two operating assets and two development properties for $174 million with net proceeds of $39 million.
- Invested $26 million in preferred equity in three new stabilized properties, and funded $8 million for five existing preferred equity and mezzanine loan investments. Committed $32 million for three new preferred equity investments.
- Increased renovation pace back to pre-COVID levels, completing 248 value-add unit upgrades during the quarter achieving an average 24.4% ROI through an average monthly rent premium of $144 per unit.
Balance Sheet and Market Activity
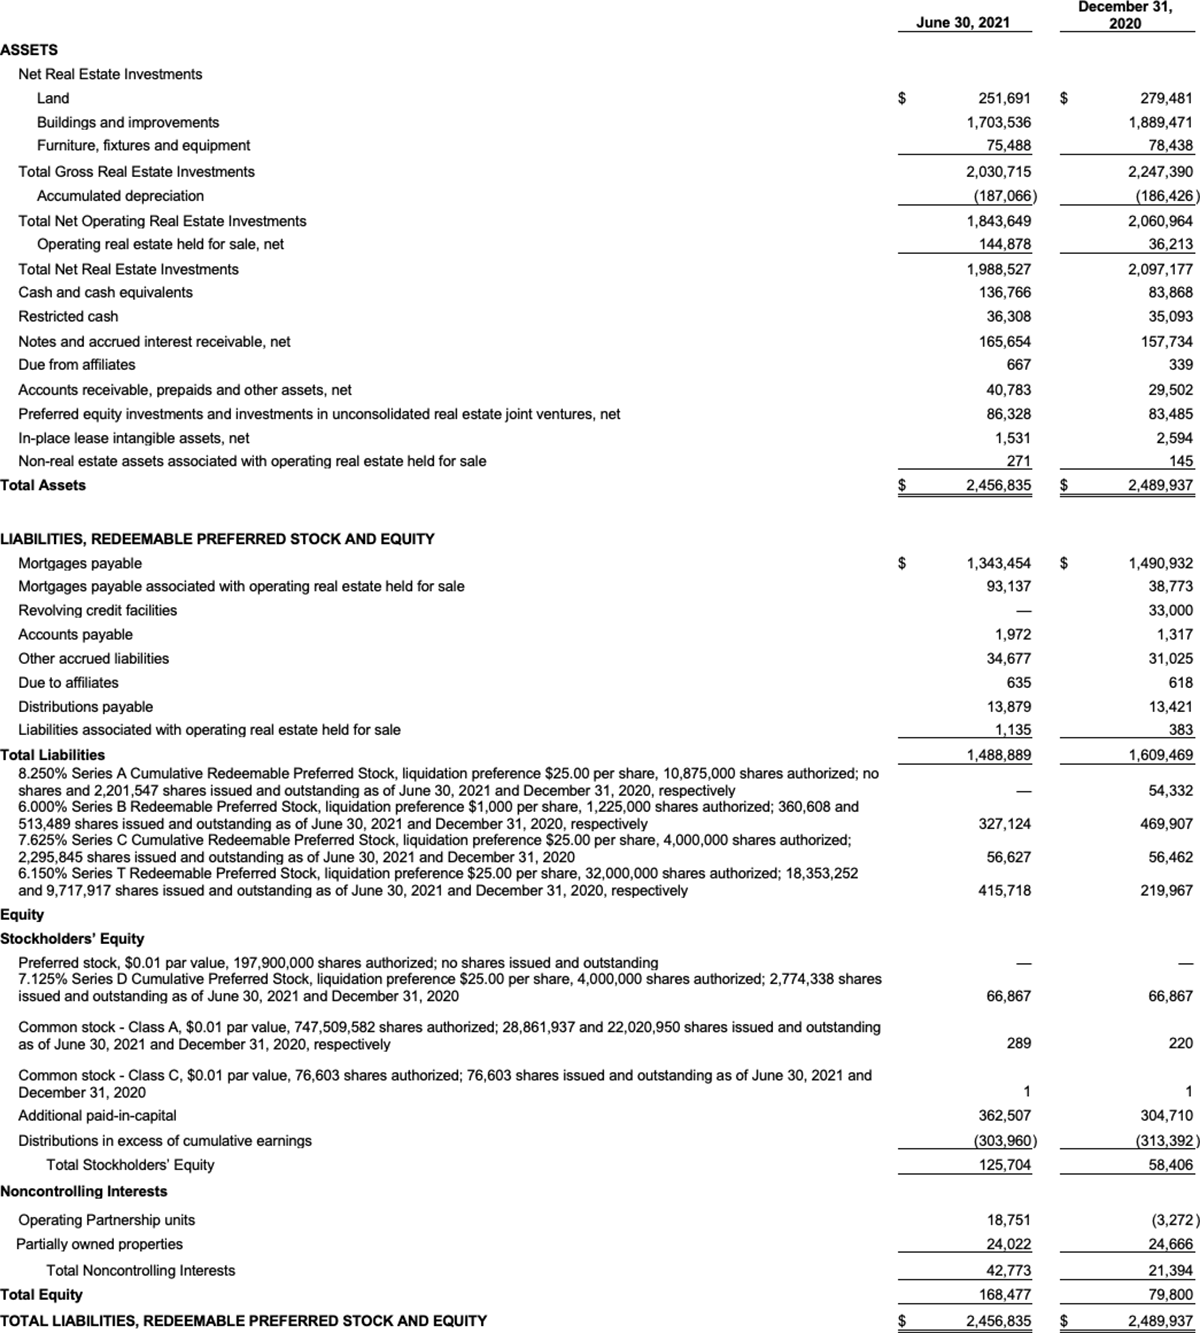
- $244.5 million of unrestricted cash and availability under revolving credit facilities and $1.4 billion of indebtedness outstanding as of June 30, 2021.
- Paid quarterly dividend of $0.1625 in cash per share of common stock.
- Raised a quarterly record of $119 million through the continuous registered Series T Preferred Stock offering with the issuance of 4.8 million shares at $25.00 per share.
- Redeemed 80,316 shares of Series B Preferred Stock through the issuance of 8,262,685 shares of Class A common stock at an average price of $9.72 per share.
- Repurchased 4,605,598 shares of Class A common stock during the quarter at an average price of $9.79 per share.
Included later in this release are definitions of NOI, CFFO and other Non-GAAP financial measures and reconciliations of such measures to their most comparable financial measures as calculated and presented under GAAP.
Second Quarter 2021 Financial Results
Net loss attributable to common stockholders for the second quarter of 2021 was ($5.4) million, compared to net income attributable to common stockholders of $15.1 million in the prior year period. Net income in 2021 was impacted by two asset sales generating $19 million in gain on sale of real estate investments compared to $58 million in the second quarter of 2020. Net (loss) income attributable to common stockholders included non-cash expenses of $22.4 million or $0.80 per share in the second quarter of 2021 compared to $19.0 million or $0.79 per share for the prior year period.
CFFO for the second quarter of 2021 was $6.0 million, or $0.16 per diluted share, compared to $5.1 million, or $0.15 per diluted share, in the prior year period. CFFO was positively impacted by an increase in property NOI of $1.7 million and a reduction in interest expense of $0.2 million. This was primarily offset by a year-over-year reduction of $0.2 million in interest income from mezzanine loan and ground lease investments, $0.5 million in preferred returns, and preferred stock dividend increase of $0.1 million.
Total Portfolio Performance

(1) Including interest income from related parties
For the second quarter of 2021, property revenues increased by 4.2% compared to the same prior year period. Total portfolio NOI was $30.8 million, an increase of $1.7 million, or 5.8%, compared to the same period in the prior year. Property NOI margins were 62.0% for the quarter, compared to 61.1% in the prior year quarter.
Same Store Portfolio Performance
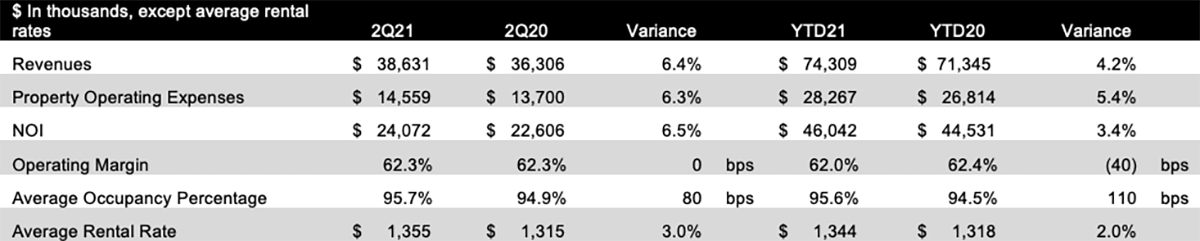
The Company’s same store portfolio for the quarter ended June 30, 2021 included 25 properties. For the second quarter of 2021, same store NOI was $24.1 million, an increase of $1.5 million, or 6.5%, compared to the 2020 period. Same store property revenues grew by 6.4% compared to the 2020 period, primarily driven by an 80-basis point increase in occupancy and 3.0% increase in average rental rates; of the Company’s 25 same store properties, 21 recognized rental rate increases and 18 recognized occupancy increases during the period. In addition, bad debt expense improved $0.7 million, while ancillary income, such as termination fees and late fees, increased $0.4 million.
Same store expenses increased 6.3%, or $0.9 million, partially due to non-controllable real estate tax increase of $0.2 million and insurance expense increase of $0.2 million due to industrywide multifamily insurance price increases. The remaining increase was due to a $0.3 million increase in discretionary seasonal maintenance as discretionary spending was limited in the prior year due to COVID-19 and an increase of $0.2 million in administrative and marketing expenses.
Renovation Activity
The Company completed 248 value-add unit upgrades during the second quarter of 2021 achieving an average 24.4% ROI through an average monthly rent premium of $144 per unit. Since inception, the Company has completed 3,275 value-add unit upgrades at an average cost of $6,065 per unit and achieved an average monthly rental rate increase of $119 per unit, equating to an average 23.6% ROI on all unit upgrades leased as of June 30, 2021. The Company has identified approximately 4,158 remaining units within the existing portfolio for value-add upgrades with similar projected economics to the completed renovations.
Portfolio Activity
The following activities were completed during the second quarter:
- On April 12, 2021, the Company made a $10.7 million preferred equity investment in the operating partnership of Peak Housing, a private REIT invested in a portfolio of 474 single-family homes located throughout Texas.
- On April 14, 2021, the Company acquired a 95% interest in an 80-unit apartment community located in Olympia, Washington, known as Yauger Park. The total purchase price was $24.5 million.
- On April 26, 2021, the Company sold Plantation Park for a gross sales price of $32 million and net proceeds to the Company of $2.7 million.
- On June 4, 2021, the Company acquired an 83% interest in a 150-unit apartment community located in Concord, North Carolina known as Wayford at Concord. The total purchase price was $44 million. The Company’s previous preferred investment of $7 million was redeemed in conjunction with the purchase.
- On June 10, 2021, the Company sold The Reserve at Palmer Ranch for $58 million to the Strategic Portfolio partner for net proceeds to the Company of $16.6 million. With the addition of the property to the Strategic Portfolio, the Company made an $11 million preferred investment in the Strategic Portfolio.
- On June 17, 2021, the Company acquired a 100% interest in a 276-unit apartment community located in Raleigh, North Carolina, known as Windsor Falls, for a total purchase price of $49 million.
- Entered into three preferred equity commitments to invest $32 million in two multifamily and one single family home development projects located in Houston and Willow Park, Texas and Charlotte, North Carolina.
- On June 25, 2021, the Company made a $4 million preferred equity investment in a stabilized asset with 372-units known as Deercross, located in Indianapolis, Indiana.
- On June 29, 2021, Vickers Historic Roswell was sold and the Company’s mezzanine loan and accrued interest of $12.9 million were paid off.
The Company completed the following activity subsequent to June 30, 2021:
- On July 7, 2021, the Company sold Park & Kingston and The District at Scottsdale for gross sales prices of $45 million and $151 million, respectively, with net proceeds to the Company of $24.7 million and $69.5 million, respectively.
- In July 2021, the Company made $19 million of preferred equity investments and provided a bridge loan of $7 million for properties located in Corpus Christi and Dallas, Texas, and Dawsonville, Georgia.
- Entered into two preferred equity commitments to invest $31 million in multifamily development projects located in San Antonio, Texas and Orange City, Florida.
Dividend
The Board of Directors has authorized, and the Company has declared, quarterly cash dividends as reflected in the following table.
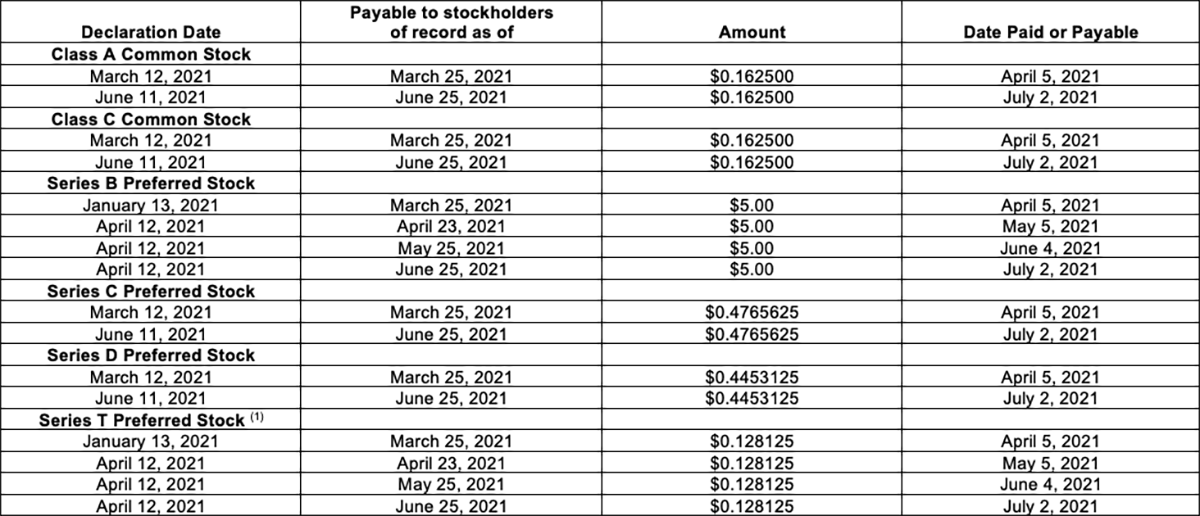
(1) Shares of newly issued Series T Preferred Stock that are held only a portion of the applicable monthly dividend period will receive a prorated dividend based on the actual number of days in the applicable dividend period during which each such share of Series T Preferred Stock was outstanding.
2021 Guidance
The Company is reaffirming its prior 2021 CFFO guidance. Based on the Company’s current outlook and market conditions, the Company anticipates 2021 CFFO in the range of $0.65 to $0.70 per share. For additional guidance details underlying earnings guidance, please see page 34 of Company’s Second Quarter 2021 Earnings Supplement available under the Investors section on the Company’s website (bluerockresidential.com).
Conference Call
All interested parties can listen to the live conference call at 11:00 AM ET on Thursday, August 5, 2021 by dialing +1 (866) 843-0890 within the U.S., or +1 (412) 317-6597, and requesting the “Bluerock Residential Conference.”
For those who are not available to listen to the live call, the conference call will be available for replay on the Company’s website two hours after the call concludes, and will remain available until September 5, 2021 at https://services.choruscall.com/mediaframe/webcast.html?webcastid=KjK0qgS7, as well as by dialing +1 (877) 344-7529 in the U.S., or +1 (412) 317-0088 internationally, and requesting conference number 10158807.
The full text of this Earnings Release and additional Supplemental Information is available in the Investors section on the Company’s website at bluerockresidential.com.
About Bluerock Residential Growth REIT, Inc.
Bluerock Residential Growth REIT, Inc. (NYSE American: BRG) is a real estate investment trust that focuses on developing and acquiring a diversified portfolio of primarily affordable Class A highly amenitized live/work/play apartment communities in demographically attractive knowledge economy growth markets to appeal to the renter by choice. The Company’s objective is to generate value through off-market/relationship-based transactions and, at the asset level, through value add improvements to properties and operations. BRG has elected to be taxed as a real estate investment trust (REIT) for U.S. federal income tax purposes.
For more information, please visit the Company’s website at bluerockresidential.com.
Forward Looking Statements
This press release contains forward-looking statements within the meaning of the Private Securities Litigation Reform Act of 1995 and other federal securities laws. These forward-looking statements are based upon the Company’s present expectations, but these statements are not guaranteed to occur. Furthermore, the Company disclaims any obligation to publicly update or revise any forward-looking statement to reflect changes in underlying assumptions or factors, of new information, data or methods, future events or other changes. Investors should not place undue reliance upon forward-looking statements. Although the Company believes that the expectations reflected in these forward-looking statements are based on reasonable assumptions, the Company’s actual results and performance could differ materially from those set forth in these forward-looking statements due to numerous factors. Currently, one of the most significant factors is the potential adverse effect of the COVID-19 pandemic on the financial condition, results of operations, cash flows and performance of the Company and its tenants, partners and employees, as well as the real estate market and the global economy and financial markets. The extent to which COVID-19 impacts the Company and its tenants, partners and employees will depend on future developments, which are highly uncertain and cannot be predicted with confidence, including the scope, severity and duration of the pandemic, the actions taken to contain the pandemic or mitigate its impact (including governmental actions that may vary by jurisdiction, such as mandated business closing; stay-at-home orders; limits on group activity; and actions to protect residential tenants from eviction), and the direct and indirect economic effects of the pandemic and containment measures, including national and local employment rates and the corresponding impact on the Company’s tenants’ ability to pay their rent on time or at all, among others. For further discussion of the factors that could affect outcomes, please refer to the risk factors set forth in Item 1A of the Company’s Annual Report on Form 10-K filed by the Company with the U.S. Securities and Exchange Commission (“SEC”) on February 23, 2021, and subsequent filings by the Company with the SEC. We claim the safe harbor protection for forward looking statements contained in the Private Securities Litigation Reform Act of 1995.
Portfolio Summary
The following is a summary of our operating real estate and mezzanine/preferred/ground lease investments as of June 30, 2021:
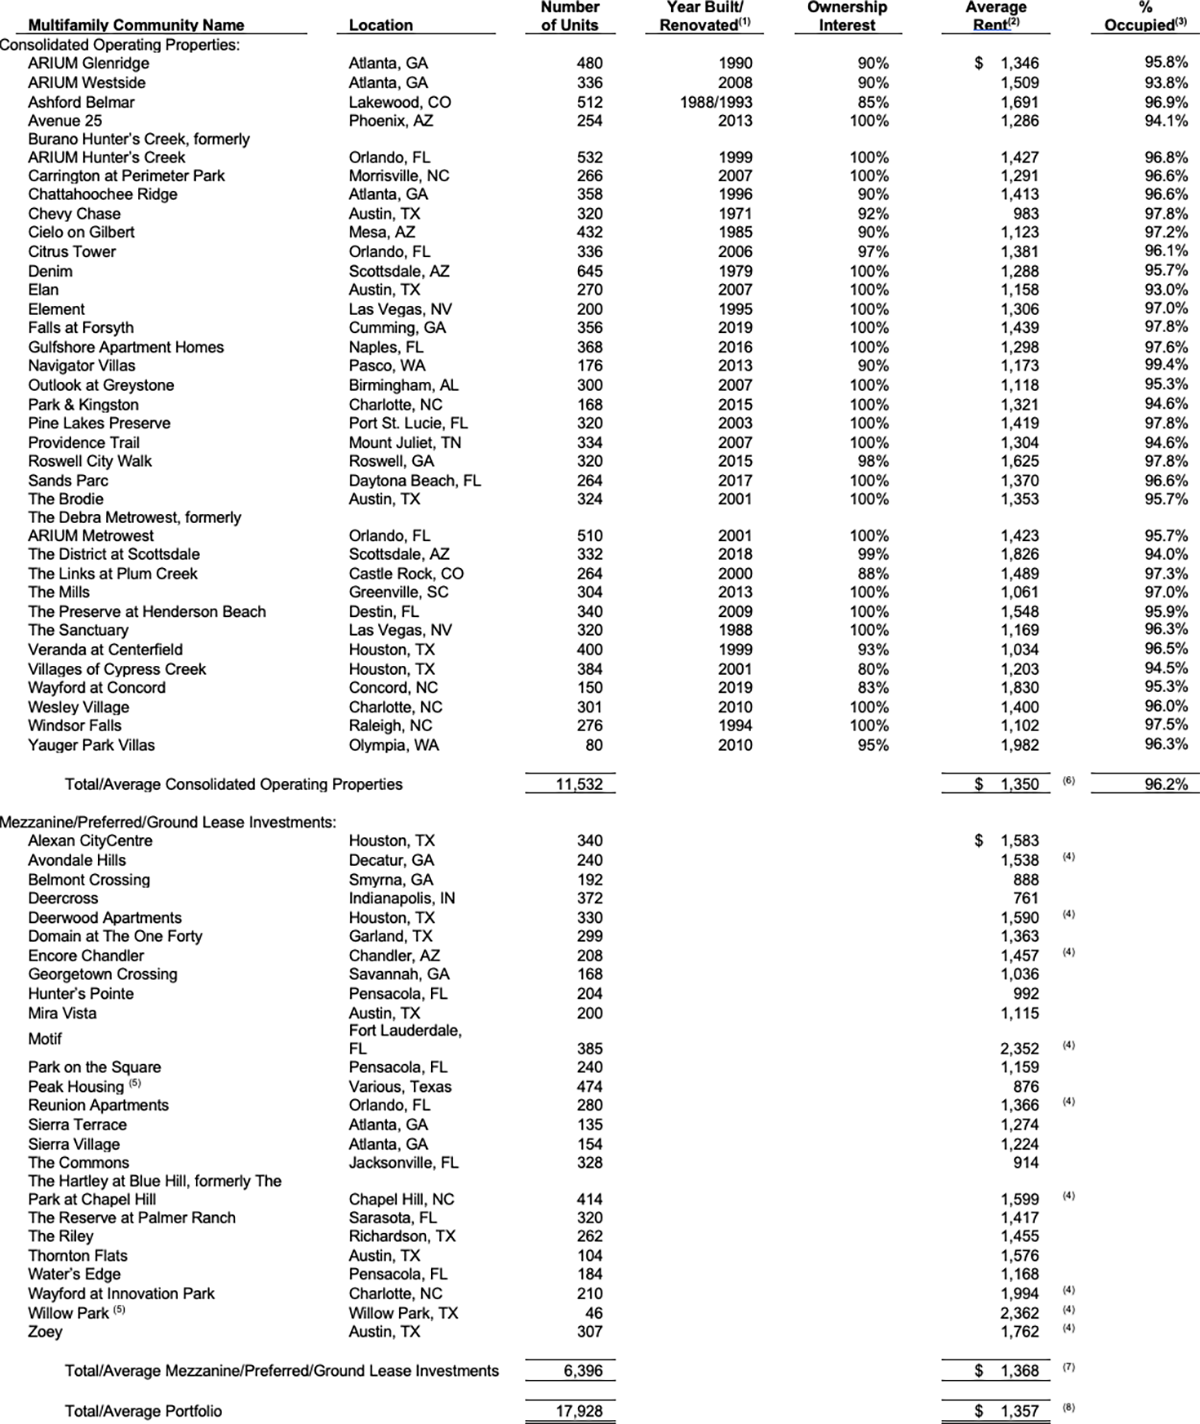
(1) Represents date of last significant renovation or year built if no renovations.
(2) Represents the average effective monthly rent per occupied unit for the three months ended June 30, 2021.
(3) Percent occupied is calculated as (i) the number of units occupied as of June 30, 2021, divided by (ii) total number of units, expressed as a percentage.
(4) Represents the average pro forma effective monthly rent per occupied unit for all expected units upon stabilization.
(5) Peak Housing and Willow Park are preferred equity investments in portfolios of single-family residential homes. The actual/planned number of units shown represents the number of single-family residential homes within each portfolio.
(6) The average effective monthly rent including sold properties was $1,351 for the three months ended June 30, 2021.
(7) The average effective monthly rent including sold properties was $1,399 for the three months ended June 30, 2021.
(8) The average effective monthly rent including sold properties was $1,368 for the three months ended June 30, 2021.
Consolidated Statement of Operations
For the Three and Six Months Ended June 30, 2021 and 2020
(Unaudited and dollars in thousands except for share and per share data)
Consolidated Balance Sheets
Second Quarter 2021
(Unaudited and dollars in thousands except for share and per share amounts)
Non-GAAP Financial Measures
The foregoing supplemental financial data includes certain non-GAAP financial measures that we believe are helpful in understanding our business and performance, as further described below. Our definition and calculation of these non-GAAP financial measures may differ from those of other REITs, and may, therefore, not be comparable.
Funds from Operations and Core Funds from Operations
We believe that funds from operations (“FFO”), as defined by the National Association of Real Estate Investment Trusts (“NAREIT”) and core funds from operations (“CFFO”) are important non-GAAP supplemental measures of operating performance for a REIT.
FFO attributable to common stockholders and unit holders is a non-GAAP financial measure that is widely recognized as a measure of REIT operating performance. We consider FFO to be an appropriate supplemental measure of our operating performance as it is based on a net income analysis of property portfolio performance that excludes non-cash items such as depreciation. The historical accounting convention used for real estate assets requires straight-line depreciation of buildings and improvements, which implies that the value of real estate assets diminishes predictably over time. Since real estate values historically rise and fall with market conditions, presentations of operating results for a REIT, using historical accounting for depreciation, could be less informative. We define FFO, consistent with the NAREIT definition, as net income (loss), computed in accordance with GAAP, excluding gains or losses on sales of depreciable real estate property, plus depreciation and amortization of real estate assets, plus impairment write-downs of certain real estate assets and investments in entities where the impairment is directly attributable to decreases in the value of depreciable real estate held by the entity, and after adjustments for unconsolidated partnerships and joint ventures. Adjustments for notes receivable, unconsolidated partnerships and joint ventures will be calculated to reflect FFO on the same basis.
CFFO makes certain adjustments to FFO, removing the effect of items that do not reflect ongoing property operations such as acquisition expenses, non-cash interest, unrealized gains and losses on derivatives, losses on extinguishment of debt and debt modification costs (includes prepayment penalties incurred and the write-off of unamortized deferred financing costs and fair market value adjustments of assumed debt), one-time weather-related costs, stock compensation expense and preferred stock accretion. Commencing in 2020, we do not deduct the accrued portion of the preferred income on our preferred equity investments from FFO to determine CFFO as the income is deemed fully collectible. The accrued portion of the preferred income totaled $1.5 million and $2.7 million for the three and six months ended June 30, 2021, respectively. We believe that CFFO is helpful to investors as a supplemental performance measure because it excludes the effects of certain items which can create significant earnings volatility, but which do not directly relate to our core recurring property operations. As a result, we believe that CFFO can help facilitate comparisons of operating performance between periods and provides a more meaningful predictor of future earnings potential.
Our calculation of CFFO differs from the methodology used for calculating CFFO by certain other REITs and, accordingly, our CFFO may not be comparable to CFFO reported by other REITs. Our management utilizes FFO and CFFO as measures of our operating performance after adjustment for certain non-cash items, such as depreciation and amortization expenses, and acquisition and pursuit costs that are required by GAAP to be expensed but may not necessarily be indicative of current operating performance and that may not accurately compare our operating performance between periods. Furthermore, although FFO and CFFO and other supplemental performance measures are defined in various ways throughout the REIT industry, we also believe that FFO and CFFO may provide us and our stockholders with an additional useful measure to compare our financial performance to certain other REITs.
Neither FFO nor CFFO is equivalent to net income (loss), including net income (loss) attributable to common stockholders, or cash generated from operating activities determined in accordance with GAAP. Furthermore, FFO and CFFO do not represent amounts available for management’s discretionary use because of needed capital replacement or expansion, debt service obligations or other commitments or uncertainties. Neither FFO nor CFFO should be considered as an alternative to net income (loss), including net income (loss) attributable to common stockholders, as an indicator of our operating performance or as an alternative to cash flow from operating activities as a measure of our liquidity.
We have acquired seven operating properties, made eight property investments through preferred equity or mezzanine loan investments, sold six operating properties and received payoffs of our mezzanine loan or preferred equity in seven investments subsequent to June 30, 2020. The results presented in the table below are not directly comparable and should not be considered an indication of our future operating performance.
The table below reconciles our calculations of FFO and CFFO to net income (loss), the most directly comparable GAAP financial measure, for the three and six months ended June 30, 2021 and 2020 (in thousands, except per share amounts):
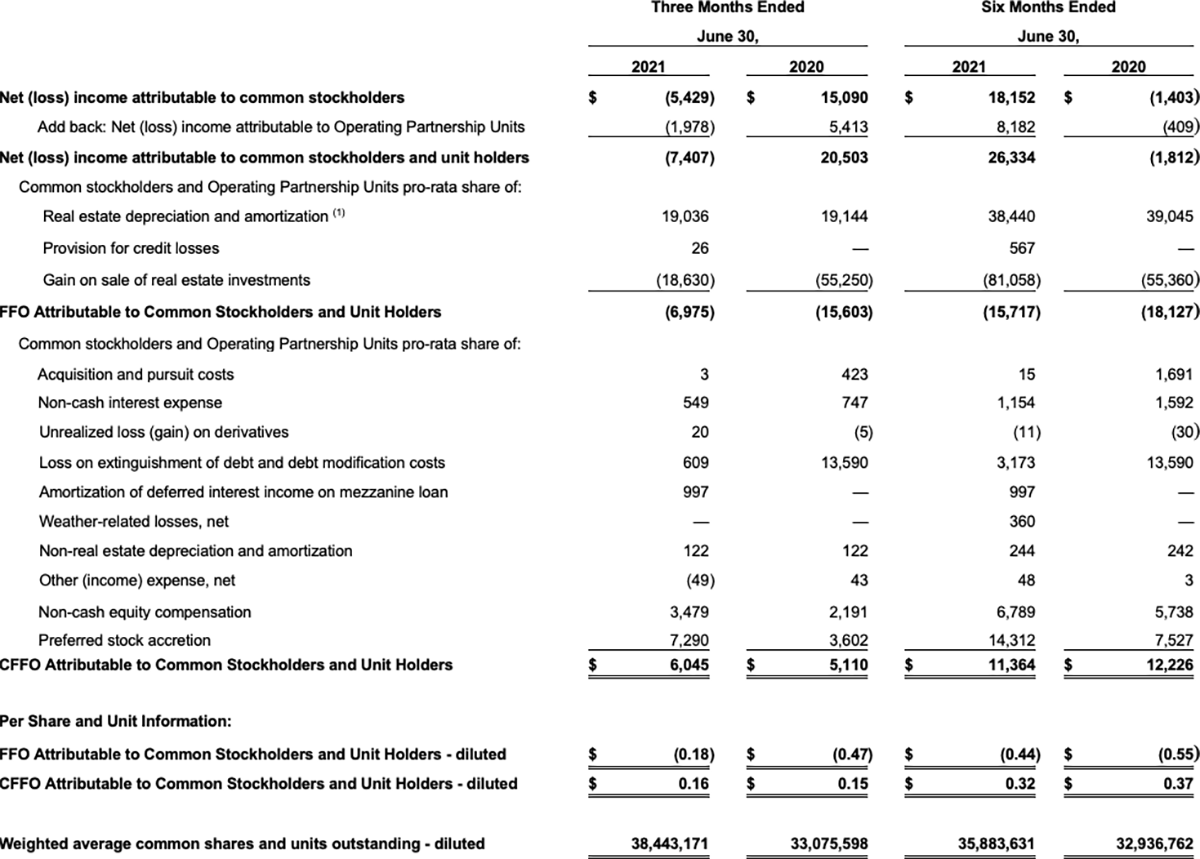
(1) The real estate depreciation and amortization amount includes our share of consolidated real estate-related depreciation and amortization of intangibles, less amounts attributable to noncontrolling interests for partially owned properties, and our similar estimated share of unconsolidated depreciation and amortization, which is included in earnings of our unconsolidated real estate joint venture investments.
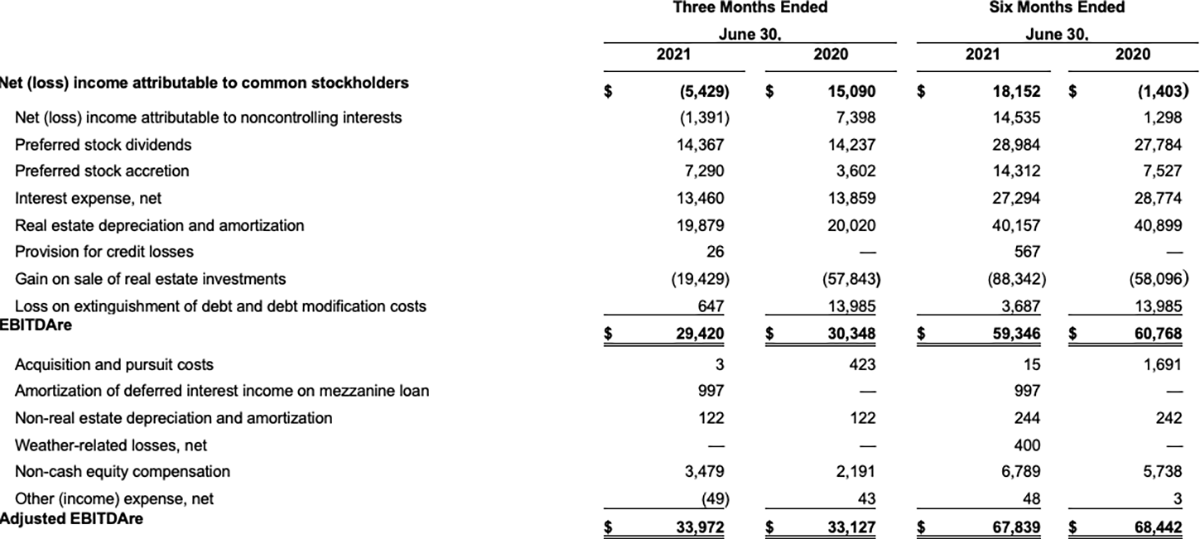
Earnings Before Interest, Taxes, Depreciation and Amortization for Real Estate (“EBITDAre”)
NAREIT defines earnings before interest, taxes, depreciation and amortization for real estate (“EBITDAre”) (September 2017 White Paper) as net income (loss), computed in accordance with GAAP, before interest expense, income taxes, depreciation and amortization expense, and further adjusted for gains and losses from sales of depreciated operating properties, and impairment write-downs of depreciated operating properties.
We consider EBITDAre to be an appropriate supplemental measure of our performance because it eliminates depreciation, income taxes, interest and non-recurring items, which permits investors to view income from operations unobscured by non-cash items such as depreciation, amortization, the cost of debt or non-recurring items.
Adjusted EBITDAre represents EBITDAre further adjusted for non-comparable items and it is not intended to be a measure of free cash flow for our management’s discretionary use, as it does not consider certain cash requirements such as income tax payments, debt service requirements, capital expenditures and other fixed charges.
EBITDAre and Adjusted EBITDAre are not recognized measurements under GAAP. Because not all companies use identical calculations, our presentation of EBITDAre and Adjusted EBITDAre may not be comparable to similarly titled measures of other companies.
Below is a reconciliation of net (loss) income attributable to common stockholders to EBITDAre and Adjusted EBITDAre (unaudited and dollars in thousands).
Same Store Properties
Same store properties are conventional multifamily residential apartments which were owned and operational for the entire periods presented, including each comparative period.
Property Net Operating Income (“Property NOI”)
We believe that net operating income, or NOI, is a useful measure of our operating performance. We define NOI as total property revenues less total property operating expenses, excluding depreciation and amortization and interest. Other REITs may use different methodologies for calculating NOI, and accordingly, our NOI may not be comparable to other REITs. We believe that this measure provides an operating perspective not immediately apparent from GAAP operating income or net income. We use NOI to evaluate our performance on a same store and non-same store basis; NOI measures the core operations of property performance by excluding corporate level expenses and other items not related to property operating performance and captures trends in rental housing and property operating expenses. However, NOI should only be used as a supplemental measure of our financial performance.
The following table reflects net income (loss) attributable to common stockholders together with a reconciliation to NOI and to same store and non-same store contributions to consolidated NOI, as computed in accordance with GAAP for the periods presented (unaudited and amounts in thousands):
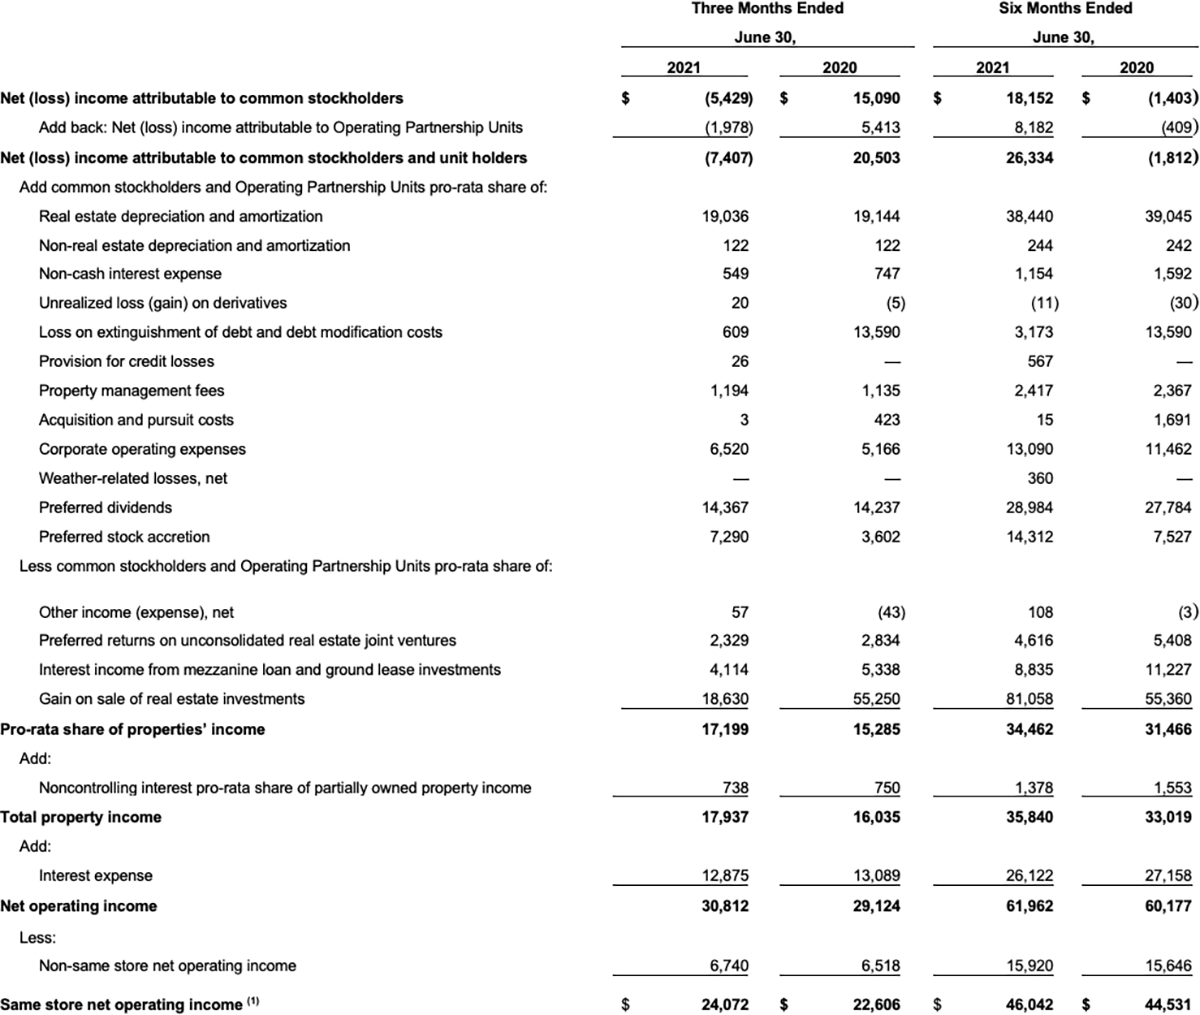
(1) Same store portfolio for the three months ended June 30, 2021 consists of 25 properties, which represent 8,882 units. Same store portfolio for the six months ended June 30, 2021 consists of 24 properties, which represent 8,628 units.