Bluerock Residential Growth REIT Announces Third Quarter 2014 Results at Top End of Guidance, AFFO at $0.22 per share vs. prior quarter at $0.13 and prior year at ($0.34)
New York, NY – Bluerock Residential Growth REIT, Inc. (NYSE MKT: BRG) (“the Company”) announced today its financial results for the quarter ended September 30, 2014.
Management Commentary
“We are pleased with our third quarter results as we met the top end of our AFFO guidance of $0.22 per share, which was an increase of 69% or $0.09 per share compared to the second quarter of 2014. We anticipate continued AFFO growth in the fourth quarter, as we successfully deployed the remaining capital from our IPO in the second quarter,” said Ramin Kamfar, the Company’s Chairman and CEO.
“We recently completed a follow-on offering in October providing an additional $33.1 million of net cash that is expected to be deployed in the next several months and will continue to grow our AFFO in 2015,” added Mr. Kamfar.
Highlights for the Third Quarter 2014 and Subsequent Events
-
- Total revenues grew 210% to $9.6 million for the quarter ended September 30, 2014 from $3.1 million for the quarter ended September 30, 2013.
- For the third quarter of 2014, the Company met the high end of adjusted funds from operations (“AFFO”) guidance of $0.22 per share, a significant increase from ($0.34) per share for the prior year quarter.
- On a sequential quarter basis, AFFO increased 69% as compared to the second quarter of 2014.
- The Company reaffirms its AFFO guidance for the fourth quarter of 2014. Due to the higher share count resulting from the follow-on offering in early October, the Company’s prior guidance translates to a range of $0.15 to $0.17 per share based on the 8.9 million shares outstanding as of today. The Company expects this figure to grow significantly in 2015 as it deploys proceeds from its follow-on offering over the next several months.
- The net loss attributable to common stockholders for the quarter ended September 30, 2014 was $2.1 million versus net income of $0.5 million for the quarter ended September 30, 2013. The net loss for the 2014 third quarter was primarily the result of non-cash depreciation and amortization expense of $4.9 million.
- Same store NOI increased 5.7% as compared to the third quarter of the prior year.
- On a sequential quarter basis, same store NOI increased 3.7% as compared to the second quarter of 2014.
- Our average portfolio occupancy for the third quarter of 2014 was 95.5% as compared to 93.2% for the second quarter of 2014, an increase of 230 basis points.
- During the third quarter of 2014, the Company closed the following investments:
- Acquisition of an additional 41.1% interest in our 220-unit, Class A Enders property located in Orlando, Florida, increasing our ownership to 89.5% in the property.
- A convertible preferred equity investment in a 340-unit, $81.8 million Class A development property to be known as Alexan CityCentre located in the heart of Houston’s Energy Corridor, in partnership with Trammell Crow as our development partner. The investment is structured to provide a 15% current return, with an option to convert into partial ownership of the underlying asset upon stabilization. The Company has projected a stabilized return on cost for the development of 7.0%, for value creation of 250+ basis points versus comparable sales in the Houston market.
- A convertible preferred equity investment in a 296-unit, $36.8 million Class A development property, located in a master-planned, Publix-anchored retail development in close proximity to the University of Central Florida and Central Florida Research Park. The investment is structured to provide a 15% current return, with an option to convert into partial ownership of the underlying asset upon stabilization. The Company has projected a stabilized return on cost for the development of 7.5%, for value creation of 200+ basis points versus comparable sales in the Orlando market.
- During the third quarter of 2014, the Company completed development and achieved ahead of projection lease up at its 23Hundred At BerryHill property located in Nashville, Tennessee. The property was 98% occupied at September 30, 2014 and is achieving market rents 18% higher than pro forma for a stabilized return on cost of 8.5% (for value creation of approximately 350 basis versus comparable product in the Nashville market).
- General and administrative expenses (excluding non-cash amortization) as a percentage of revenue declined significantly, to 6.9% for the quarter ended September 30, 2014 from 18.1% for the prior year quarter, primarily due to an increase in our asset base and more favorable terms of our new management agreement. The Company expects its general and administrative expenses as a percentage of revenue to continue to decline as it continues to grow its asset base.
- On October 8, 2014, the Company completed a follow-on offering of 3,035,444 shares of Class A common stock at a public offering price of $11.90 per share for total gross proceeds of $36.1 million. The net proceeds of the offering are estimated to be approximately $33.1 million after deducting underwriting discounts and commissions and estimated offering costs.
- The Company declared monthly dividends for the fourth quarter of 2014 equal to a quarterly rate of $0.29 per share on the Company’s Classes A and B common stock. This equates to a 9.5% annualized yield based on the closing price of $12.25 for the Class A common stock as of October 31, 2014.
- On October 30, 2014, the Company’s Board of Directors approved the purchase of a 306-unit apartment community located in Orlando, Florida, known as Grande Lakes. The total purchase price of the property is $43.3 million in which the Company would own a 95% interest. Constructed in 2005, Grande Lakes is a Class A multifamily community featuring one-, two-, and three-bedroom units averaging 1,048 square feet. We expect to close on Grande Lakes in early November 2014.
Financial Results Third Quarter 2014
AFFO for the third quarter of 2014 was $1.3 million, or $0.22 per diluted share, as compared to a deficit of ($0.4) million, or ($0.34) per diluted share as compared to the prior year period. The increase in AFFO from the prior year period is driven by making additional investments in eight properties during the second and third quarters of 2014 and a reduction of cash general and administrative expenses as a percentage of revenue from 18.1% to 6.9% due to an increase in our asset base, and more favorable terms of our new management agreement, which began on April 2, 2014, the date of our initial public offering. The Company expects its general and administrative expenses as a percentage of revenue to continue to decline as it continues to grow its asset base.
Net loss attributable to common stockholders for the third quarter of 2014 was $2.1 million or ($0.41) per basic and diluted share, as compared to earnings of $0.5 million or $0.51 per basic and $0.50 per diluted share, in the prior year period. The net loss for the 2014 third quarter was primarily the result of non-cash depreciation and amortization expense of $4.9 million. The earnings for the prior period included a $1.6 million gain from the sale of our Hillsboro property.
Same Store Portfolio Performance
Same store NOI for the third quarter of 2014 increased 5.7% to $2.35 million as compared to $2.22 million in the same period in the prior year. This increase was driven by a 4.0% increase in same store revenue which was primarily attributable to a 2.2% increase in average revenue per occupied unit and the acquisition of 22 additional units at our Enders property, balanced by a 60 basis point decrease in average occupancy. Same store expenses increased 1.3%.
On a sequential quarter basis, third quarter 2014 same store NOI increased 3.7% compared to the second quarter 2014. This increase was driven by a 4.3% increase in same store revenue which was primarily attributable to a 2.8% increase in average occupancy and a 1.2% increase in average revenue per occupied unit. Same store expenses increased 5.1% primarily due to a concentration of a one-time expense associated with a 5.7% increase in average occupancy at our Village Green of Ann Arbor property (from 92.6% to 98.3%).
Portfolio Summary and Transaction Activity
The following is a summary of our investments as of September 30, 2014:
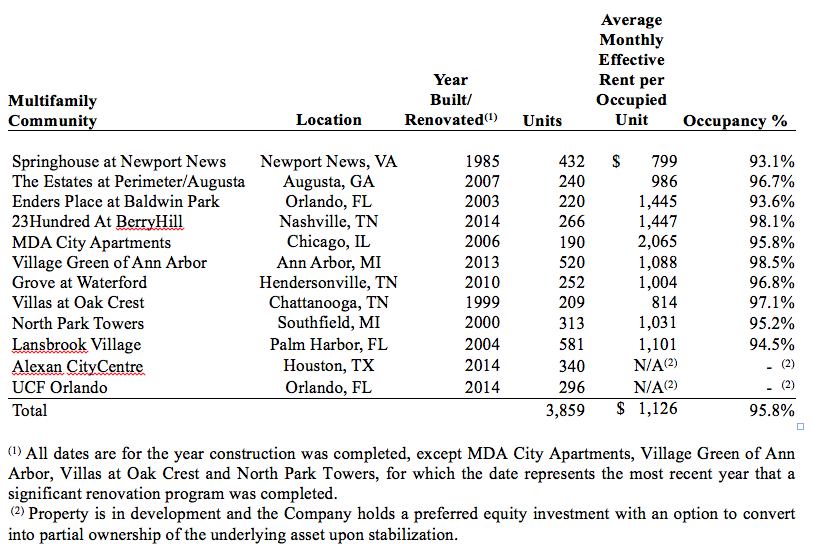
The following is a summary of acquisitions and investments during the third quarter of 2014:
Investment in Alexan CityCentre: On July 1, 2014, the Company made an investment of $6.6 million in a convertible preferred equity investment, to develop a 340-unit class A, multifamily community located in Houston, Texas, to be known as Alexan CityCentre. Total development costs of the community are projected to be $81.8 million. Our underwriting projected a return on cost for the project of over 7.0% at stabilization, for value creation of 250+ basis points versus comparable sales in the Houston market.
Investment in UCF: On July 29, 2014, the Company made a $3.6 million convertible preferred equity investment to develop a 296-unit class A multifamily community located in Orlando, Florida, in close proximity to the University of Central Florida and Central Florida Research Park, and will be a featured component of a master-planned, Publix-anchored retail development known as Town Park. Total development costs are projected to be $36.8 million. Our underwriting projects a return on cost of over 7.5% at stabilization, for value creation of 200+ basis points versus comparable areas sales in the Orlando market.
The following is a summary of an anticipated acquisition after the close of the third quarter 2014:
Acquisition of Grande Lakes: In early November 2014, the Company expects to close on a 306-unit apartment community located in Orlando, Florida, known as Grande Lakes. The total purchase price of the property is $43.3 million in which the Company would own a 95% interest. Constructed in 2005, Grande Lakes is a Class A multifamily community featuring one-, two-, and three-bedroom units averaging 1,048 square feet. The community features an abundance of amenities, including a resort style pool, fitness center, with indoor basketball court, volleyball court, and business and media centers. Additionally, the unit interiors are institutional quality with nine-foot ceilings, crown moldings, black appliances, upgraded lighting and garden bath tubs.
Dividend Details
On October 10, 2014, the Company’s Board of Directors declared monthly dividends for the fourth quarter of 2014 equal to a quarterly rate of $0.29 per share on the Company’s Class A common stock and $0.29 per share on the Company’s Class B common stock, payable to the stockholders of record as of October 25, 2014, November 25, 2014 and December 25, 2014, which will be paid in cash on November 5, 2014, December 5, 2014 and January 5, 2015, respectively. Holders of OP and LTIP units are entitled to receive “distribution equivalents” at the same time as dividends are paid to holders of the Company’s Class A common stock.
The declared dividends equal a monthly dividend on the Class A common stock and the Class B common stock as follows: $0.096666 per share for the dividend paid to stockholders of record as of October 25, 2014, $0.096667 per share for the dividend paid to stockholders of record as of November 25, 2014, and $0.096667 per share for the dividend paid to stockholders of record as of December 25, 2014.
Non-GAAP Financial Measures
The foregoing supplemental financial data includes certain non-GAAP financial measures that we believe are helpful in understanding our business, as further described below. Our definition and calculation of these non-GAAP financial measures may differ from those of other REITs, and may, therefore, not be comparable.
Funds from Operations (“FFO”) and Adjusted Funds from Operations (“AFFO”)
Funds from operations, or FFO, is a non-GAAP financial measure that is widely recognized as a measure of REIT operating performance. We consider FFO to be an appropriate supplemental measure of our operating performance as it is based on a net income analysis of property portfolio performance that excludes non-cash items such as depreciation. The historical accounting convention used for real estate assets requires straight-line depreciation of buildings and improvements, which implies that the value of real estate assets diminishes predictably over time. Since real estate values historically rise and fall with market conditions, presentations of operating results for a REIT, using historical accounting for depreciation, could be less informative. We define FFO, consistent with the National Association of Real Estate Investment Trusts, or NAREIT’s, definition, as net income, computed in accordance with GAAP, excluding gains (or losses) from sales of property, plus depreciation and amortization of real estate assets, and after adjustments for unconsolidated partnerships and joint ventures. Adjustments for unconsolidated partnerships and joint ventures will be calculated to reflect FFO on the same basis.
In addition to FFO, we use adjusted funds from operations, or AFFO. AFFO is a computation made by analysts and investors to measure a real estate company’s operating performance by removing the effect of items that do not reflect ongoing property operations.
We further adjust FFO by adding back certain items that are not added to net income in NAREIT’s definition of FFO, such as acquisition expenses, equity based compensation expenses, and any other non-recurring or non-cash expenses, which are costs that do not relate to the operating performance of our properties, and subtracting recurring capital expenditures (and when calculating the quarterly incentive fee payable to our Manager only, we further adjust FFO to include any realized gains or losses on our real estate investments).
Our calculation of AFFO differs from the methodology used for calculating AFFO by certain other REITs and, accordingly, our AFFO may not be comparable to AFFO reported by other REITs. Our management utilizes FFO and AFFO as measures of our operating performance after adjustment for certain non-cash items, such as depreciation and amortization expenses, and acquisition expenses and pursuit costs that are required by GAAP to be expensed but may not necessarily be indicative of current operating performance and that may not accurately compare our operating performance between periods. Furthermore, although FFO, AFFO and other supplemental performance measures are defined in various ways throughout the REIT industry, we also believe that FFO and AFFO may provide us and our stockholders with an additional useful measure to compare our financial performance to certain other REITs. We also use AFFO for purposes of determining the quarterly incentive fee, if any, payable to our Manager.
Neither FFO nor AFFO is equivalent to net income or cash generated from operating activities determined in accordance with GAAP. Furthermore, FFO and AFFO do not represent amounts available for management’s discretionary use because of needed capital replacement or expansion, debt service obligations or other commitments or uncertainties. Neither FFO nor AFFO should be considered as an alternative to net income as an indicator of our operating performance or as an alternative to cash flow from operating activities as a measure of our liquidity.
We made no investments, had one full disposition and two partial dispositions in 2013, and have acquired interests in eight properties during the nine months ended September 30, 2014. The results presented in the following table are not directly comparable and should not be considered an indication of our future operating performance. (Unaudited and dollars in thousands, except share and per share data).
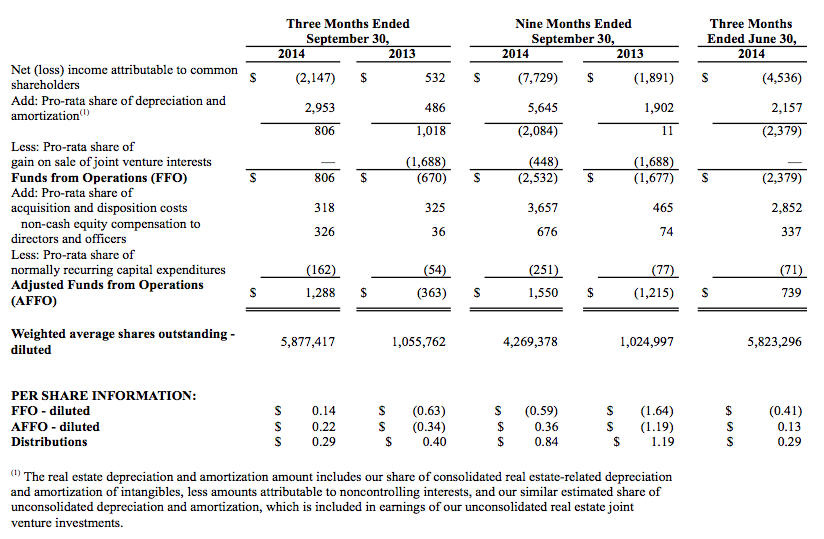
Earnings Before Interest, Income Taxes, Depreciation and Amortization (“EBITDA”)
EBITDA is defined as earnings before interest, income taxes, depreciation and amortization. We consider EBITDA to be an appropriate supplemental measure of our performance because it eliminates depreciation, income taxes, interest and non-recurring items, which permits investors to view income from operations unclouded by non-cash depreciation, amortization, the cost of debt or non-recurring items. Below is a reconciliation of net income applicable to common stockholders to EBITDA. (Unaudited and dollars in thousands).
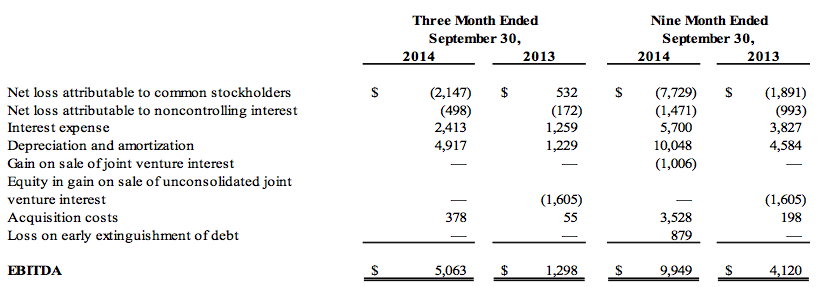
Recurring Capital Expenditures
We define recurring capital expenditures as expenditures that are incurred at every property and exclude development, investment, revenue enhancing and non-recurring capital expenditures.
Non-Recurring Capital Expenditures
We define non-recurring capital expenditures as expenditures for significant projects that upgrade units or common areas and projects that are revenue enhancing.
Same Store Properties
Same store properties are conventional multifamily residential apartments which were owned and operational for the entire periods presented, including each comparative period.
Property Net Operating Income (“Property NOI”)
We believe that net operating income, or NOI, is a useful measure of our operating performance. We define NOI as total property revenues less total property operating expenses, excluding depreciation and amortization and interest. Other REITs may use different methodologies for calculating NOI, and accordingly, our NOI may not be comparable to other REITs. We believe that this measure provides an operating perspective not immediately apparent from GAAP operating income or net income. We use NOI to evaluate our performance on a same store and non-same store basis because NOI measures the core operations of property performance by excluding corporate level expenses and other items not related to property operating performance and captures trends in rental housing and property operating expenses. However, NOI should only be used as an alternative measure of our financial performance. The following table reflects same store and non-same store contributions to consolidated NOI together with a reconciliation of NOI to net loss as computed in accordance with GAAP for the periods presented (unaudited and amounts in thousands):
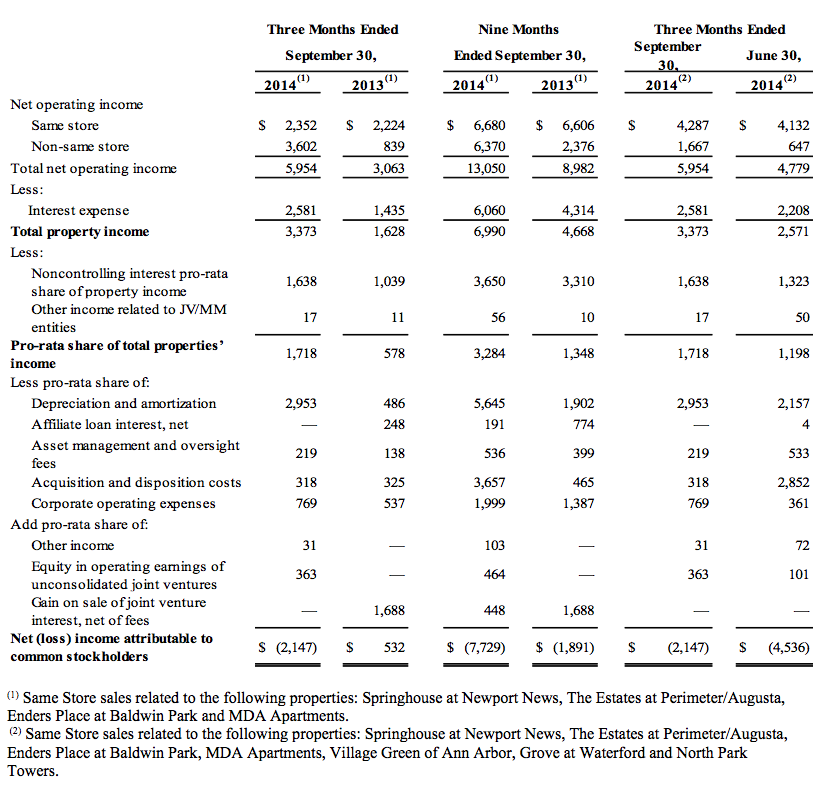
Conference Call
All interested parties can listen to the live conference call webcast at 3:00 PM ET on Tuesday, November 4, 2014 by dialing 877.270.2148 within the U.S., or +1 (412) 902-6510, and requesting the “BRG call.” For those who are not available to listen to the live call, the webcast will be available for replay on the Company’s website two hours after the call concludes, and will remain available until December 4, 2014 at http://services.choruscall.com/links/blue141104.htm, as well as by dialing +1 (877) 344-7529 in the U.S., or +1 (412) 317-0088 internationally, and requesting conference number 10055679.
About Bluerock Residential Growth REIT, Inc.
Bluerock Residential Growth REIT, Inc. (NYSE MKT: BRG) is a real estate investment trust formed to acquire a diversified portfolio of institutional-quality apartment properties in demographically attractive growth markets throughout the United States. The Company has elected to be taxed as a real estate investment trust (REIT) for U.S. federal income tax purposes. Please visit the Company’s website at www.bluerockresidential.com.
Forward Looking Statements
This press release contains forward looking statements within the meaning of the Private Securities Litigation Reform Act of 1995 and other federal securities laws. These forward looking statements are based on the Company’s present expectations, but these statements are not guaranteed to occur, including claims relative to the Company’s pipeline, the Company’s dividends, the fee structure under the Management Agreement, the Company’s future performance, management’s commentary relating to future income and portfolio growth and operating results, dividend coverage and future acquisitions. Furthermore, the Company disclaims any obligation to publicly update or revise any forward-looking statement to reflect changes in underlying assumptions or factors, of new information, data or methods, future events or other changes. Investors should not place undue reliance upon forward looking statements. For further discussion of the factors that could affect outcomes, please refer to the “Risk Factors” section of the prospectus dated October 2, 2014 and filed by the Company with the Securities and Exchange Commission (“SEC”) on October 3, 2014, and subsequent filings by the Company with the SEC.
[box style=”1″] Download PDF[/box]