Bluerock Residential Growth REIT Announces Third Quarter 2020 Results
– Total Revenues Grew 1.9% YoY –
– Same Store Occupancy Increased 1.1% –
– Same Store Average Rent Increased 0.4% YoY –
– Collected 97% of Third Quarter Rents Including Payment Plans –
New York, NY (November 5, 2020) – Bluerock Residential Growth REIT, Inc. (NYSE American: BRG) (“the Company”), an owner of highly amenitized multifamily apartment communities, announced today its financial results for the quarter ended September 30, 2020.
“Our solid same store occupancy, average rent, and operating margins performance continue to validate our market, asset and operating strategy even with the challenges of COVID-19,” said Ramin Kamfar, Company Chairman and CEO. “Our rental collections reflect favorably on our investments in highly amenitized, live/work/play apartment communities in knowledge-based economies such as health care, technology, education, sciences and finance sectors. We are making accretive capital allocation decisions, and while, we acknowledge the potential for future challenges due to the pandemic, we have a robust pipeline of growth opportunities.”
Third Quarter Highlights
- Total revenues grew 1.9% to $54.6 million for the quarter from $53.5 million in the prior year period.
- Net loss attributable to common stockholders for the third quarter of 2020 was ($0.71) per diluted share, as compared to net income attributable to common stockholders of $0.75 per diluted share in the prior year period.
- Property Net Operating Income (“NOI”) grew 3.7% to $29.1 million, from $28.0 million in the prior year period.
- Improved operating margins by 70 basis points year over year to 59.8%.
- Portfolio occupancy was 95.1% at September 30, 2020, up 130 basis points from the prior year.
- Same store occupancy increased 110 basis points and same store average rent increased 0.4%, as compared to the prior year period.
- Same store revenue increased 0.6% and same store NOI decreased 1.3%, as compared to the prior year period.
- Collected 97% of rents, including payment plans of 1%, from its multifamily properties for the three months ended September 30, 2020.
- Core funds from operations attributable to common shares and units (“CFFO”) was $5.4 million, compared to $5.8 million in the prior year period. CFFO per share was $0.16 for the third quarter as compared to $0.19 in the prior year period. CFFO per share was impacted by $0.03 as a result of the Company’s strategic decision to reduce its investment pace and hold excess liquidity during the quarter. With its strong pipeline, the Company expects to invest available capital on a go forward basis.
- Consolidated real estate investments, at cost, were approximately $2.2 billion.
- Acquired a 92% interest in a multifamily community of 320-units for a total purchase price of $34.5 million.
- Invested in two new development mezzanine loans with a total commitment of $21.7 million, of which $1.9 million was funded.
- Completed additional funding for ten preferred equity, mezzanine loan, and ground lease investments totaling $27.1 million.
- In October 2020, sold one operating asset, Cade Boca Raton, for a gross sales price of $37.8 million and net proceeds to the Company of $10.2 million. The asset was sold at an in-place cap rate of 3.3% adjusting for the buyer’s year one taxes and $250 per unit replacement reserves.
- Completed 86 value-add unit upgrades during the quarter achieving an average 25.5% ROI.
- Paid quarterly dividend of $0.1625 in cash per share of common stock.
- Raised $66.2 million through its continuous registered Series T Preferred Stock offering in the quarter.
- Announced a partial redemption of its 8.25% Series A Cumulative Redeemable Preferred Stock.
- As of September 30, 2020, had $245.4 million of unrestricted cash and availability under its revolving credit facilities.
Included later in this release are definitions of NOI, CFFO and other Non-GAAP financial measures and reconciliations of such measures to their most comparable financial measures as calculated and presented under GAAP.
COVID-19 Pandemic Update
Since the beginning of the COVID-19 pandemic, the Company executed on actions to prioritize the health and well-being of its tenants, business partners, service providers and employees, while striving to provide the highest quality living experience possible and facilitating virtual leasing and services.
Post-Quarter Operational Performance
- As of October 31, 2020, the Company has collected 97% of October rents, including payment plans of 0.5%, from its multifamily properties.
- Occupancy and availability remains strong at 95.4% and 7.9%, as of October 31, 2020.
- In October average lease rate grew 1.2% year over year.
Current Liquidity
Due to the uncertainties presented by the COVID-19 pandemic, the Company continues to take measures to increase its liquidity and believes it has sufficient liquidity through this uncertain period.
- The Company has approximately $168.5 million in unrestricted cash and availability under its revolving credit facilities as of October 31, 2020.
- Over $28 million was raised from the Company’s continuous registered Series T Preferred Stock offering during October 2020.
Third Quarter 2020 Financial Results
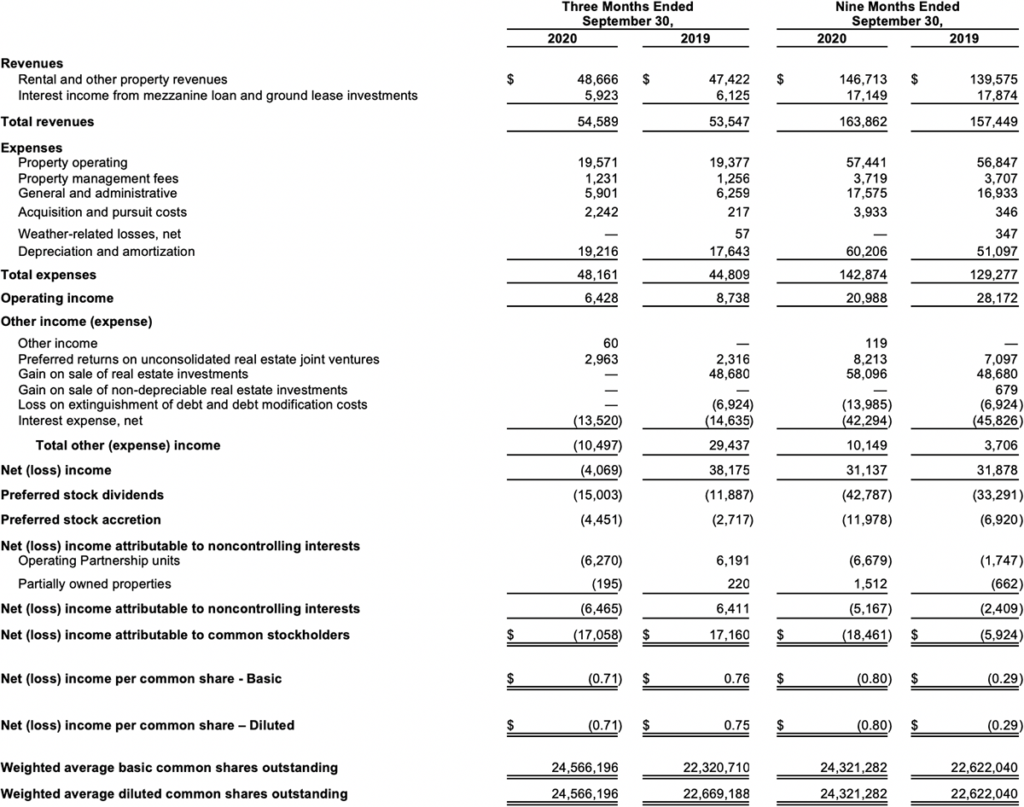
Net loss attributable to common stockholders for the third quarter of 2020 was ($17.1) million, compared to net income attributable to common stockholders of $17.2 million in the prior year period. Net income (loss) attributable to common stockholders included non-cash expenses of $19.4 million or $0.79 per share in the third quarter of 2020 compared to $17.5 million or $0.77 per share for the prior year period.
CFFO for the third quarter of 2020 was $5.4 million, or $0.16 per diluted share, compared to $5.8 million, or $0.19 per diluted share, in the prior year period. CFFO was impacted by the Company’s strategic decision to reduce its investment pace in the near term and to increase its cash position. CFFO was positively impacted by growth in property NOI of $1.1 million, preferred returns of $1.0 million, and a decrease in interest expense of $1.0 million. This was primarily offset by a year-over-year decrease in interest income of $0.2 million, an increase in general and administrative expense of $0.1 million and preferred stock dividends of $3.1 million.
Total Portfolio Performance
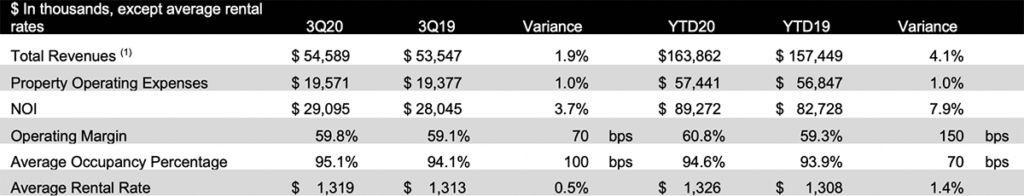
(1) Including interest income from related parties
For the third quarter of 2020, property revenues increased by 2.6% compared to the same prior year period. Total portfolio NOI was $29.1 million, an increase of $1.1 million, or 3.7%, compared to the same period in the prior year. Property NOI margins expanded by 70 basis points to 59.8% of revenue for the quarter, compared to 59.1% of revenue in the prior year quarter.
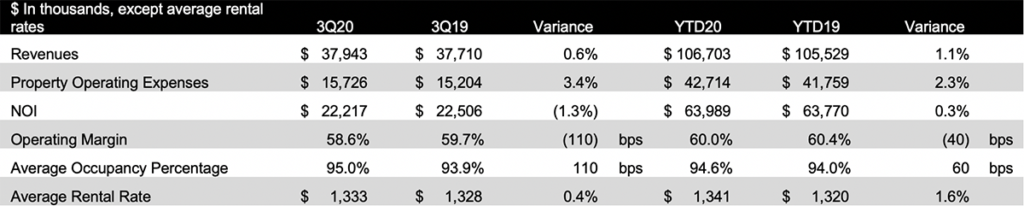
The Company’s same store portfolio for the quarter ended September 30, 2020 included 26 properties. For the third quarter of 2020, same store NOI was $22.2 million, a decrease of $0.3 million, or (1.3%), compared to the same period in the prior year. Same store property revenues increased by 0.6% compared to the same prior year period, primarily driven by a 110-basis point increase in occupancy and 0.4% increase in average rental rates as fourteen of the Company’s twenty-six same store properties recognized rental rate increases during the period, but offset by $0.2 million increase in bad debt expense and $0.1 million less in ancillary income, such as termination fees and late fees, due to the impact of COVID-19 and related Federal and state eviction moratoriums.
Same store expenses increased 3.4%, or $0.5 million, primarily due to non-controllable expenses; real estate taxes increased $0.25 million from prior year due to municipality tax increases and insurance expenses increased $0.25 million due to industrywide multifamily price increases.
Renovation Activity
The Company completed 86 value-add unit upgrades during the third quarter achieving a 25.5% ROI. Since inception, within the existing portfolio, the Company has completed 2,890 value-add unit upgrades at an average cost of $5,873 per unit and achieved an average monthly rental rate increase of $115 per unit, equating to a 23.6% ROI on all unit upgrades leased as of September 30, 2020. The Company has identified approximately 4,486 remaining units within the existing portfolio for value-add upgrades with similar projected economics to the completed renovations. Due to the uncertainty surrounding the COVID-19 impact, the Company had temporarily suspended interior renovations at several properties subject to better visibility on the economic recovery, and now expects to complete between 250 and 300 unit renovations in 2020.
Portfolio Activity
The Company completed the following investments:
- Acquired a 92% interest in a 320-unit apartment community located in Austin, Texas, known as Chevy Chase. The total purchase price was $34.5 million, funded in part by a $24.4 million mortgage loan secured by the property.
- Entered into two development mezzanine loans with unrelated third parties in the third quarter. The mezzanine loans are for apartment communities with a total of 520-units in Orlando, Florida, and Atlanta, Georgia. The Company funded approximately $1.9 million of a total mezzanine commitment of $21.7 million.
- Funded $27.1 million under existing preferred equity, mezzanine loan, and ground lease commitments in ten investments.
The Company completed the following sales activity:
- Subsequent to quarter end, sold Cade Boca Raton for a gross sales price of $37.8 million and net proceeds to the Company of $10.2 million. The asset was sold at an in-place cap rate of 3.3% adjusting for the buyer’s year one taxes and $250 per unit replacement reserves.
Balance Sheet
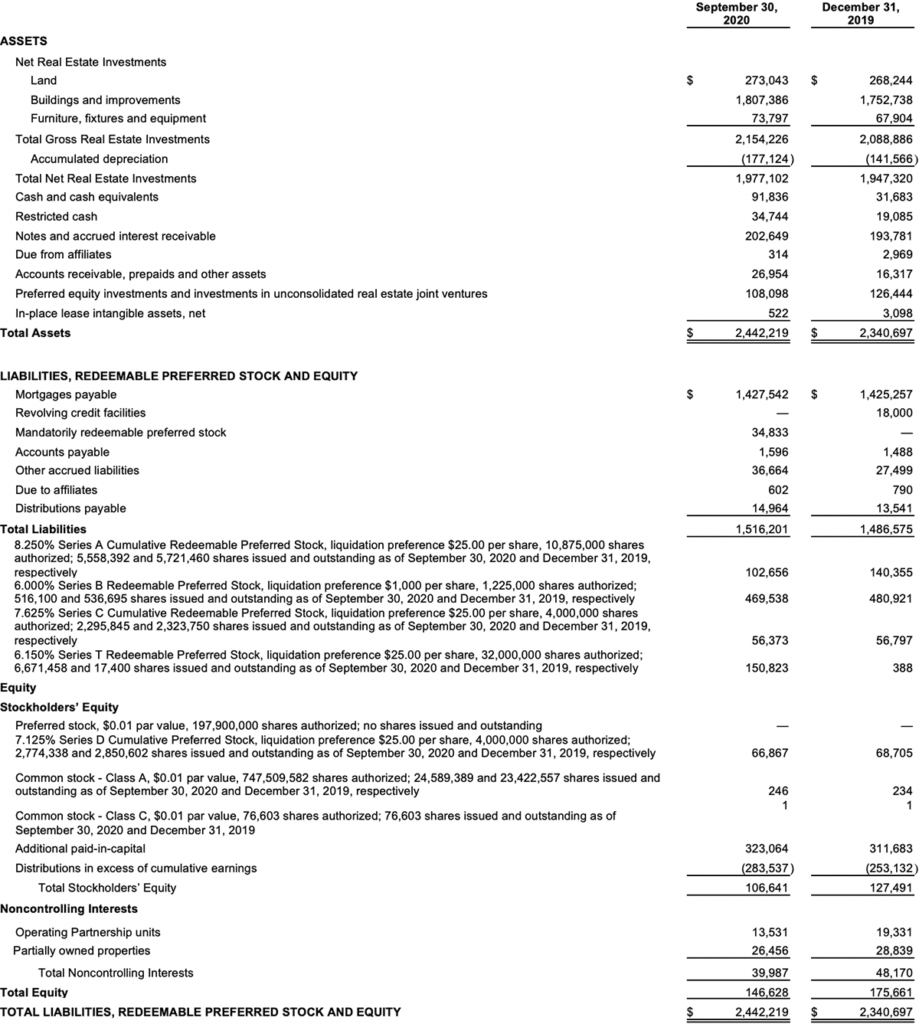
As of September 30, 2020, the Company had $245.4 million of unrestricted cash and availability under its revolving credit facilities, and $1.4 billion of indebtedness outstanding.
During the third quarter, the Company raised gross proceeds of approximately $66.2 million through the issuance of 2.6 million shares of Series T Preferred Stock at $25.00 per share. The Series T Preferred Stock continuous offering offers 20,000,000 preferred shares in the primary offering, along with 12,000,000 preferred shares pursuant to a dividend reinvestment plan. The preferred shares are offered at $25.00 per share and pay cumulative monthly dividends at a 6.15% annual rate, along with an annual stock dividend of up to 0.2% for five years.
The Company repurchased 103,574 shares of Class A Common Stock during the third quarter at an average price of $7.30 under its $50.0 million share repurchase plan announced in December 2019.
On October 21, 2020, the Company redeemed 1,393,294 shares of its 8.25% Series A Cumulative Redeemable Preferred Stock, representing approximately 25% of the total outstanding shares of Series A Preferred Stock. The total cost to redeem the shares was $35 million, including accrued and unpaid dividends.
Dividend
The Board of Directors authorized, and the Company declared, a quarterly cash dividend for the third quarter of 2020 equal to a quarterly rate of $0.1625 per share on its Class A and Class C Common Stock, payable to the stockholders of record as of September 25, 2020, and was paid on October 5, 2020. A portion of each dividend may constitute a return of capital for tax purposes.
The Board of Directors authorized, and the Company declared, a quarterly cash dividend on its 8.250% Series A Cumulative Redeemable Preferred Stock for the third quarter of 2020, in the amount of $0.515625 per share. In addition, the Board of Directors authorized, and the Company declared, a quarterly cash dividend on its 7.625% Series C Cumulative Redeemable Preferred Stock for the third quarter of 2020, in the amount of $0.4765625 per share. Further, the Board of Directors authorized, and the Company declared, a quarterly cash dividend on its 7.125% Series D Cumulative Preferred Stock for the third quarter of 2020, in the amount of $0.4453125 per share. The dividends were payable to the stockholders of record as of September 25, 2020, and were paid on October 5, 2020.
The Board of Directors authorized, and the Company declared, a monthly dividend of $5.00 per share of Series B Preferred Stock, payable to the stockholders of record as of July 24, 2020, August 25, 2020, and September 25, 2020, which were paid in cash on August 5, 2020, September 4, 2020 and October 5, 2020, respectively.
The Board of Directors authorized, and the Company declared, a monthly dividend of $0.128125 per share of Series T Preferred Stock, prorated on the basis of the actual number of days in the applicable dividend period during which each share was outstanding. Such pro-rated dividends were payable to the stockholders of record as of July 24, 2020, August 25, 2020, and September 25, 2020, which were paid in cash on August 5, 2020, September 4, 2020 and October 5, 2020, respectively.
On October 9, 2020, the Board of Directors authorized, and the Company declared, a monthly dividend of $5.00 per share of Series B Preferred Stock, payable to the stockholders of record as of October 23, 2020, which was paid in cash on November 5, 2020, and as of November 25, 2020, and December 24, 2020, which will be paid in cash on December 4, 2020 and January 5, 2021, respectively.
On October 9, 2020, the Board of Directors authorized, and the Company declared, a monthly dividend of $0.128125 per share of Series T Preferred Stock, prorated on the basis of the actual number of days in the applicable dividend period during which each share was outstanding. Such pro-rated dividends are payable to the stockholders of record as of October 23, 2020, which was paid in cash on November 5, 2020, and as of November 25, 2020, and December 24, 2020, which will be paid in cash on December 4, 2020 and January 5, 2021, respectively.
2020 Guidance
The Company withdrew its full year 2020 guidance on May 11, 2020, due to inherent uncertainty regarding the economic effects of the COVID-19 pandemic.
Conference Call
All interested parties can listen to the live conference call at 11:00 AM ET on Thursday, November 5, 2020 by dialing +1 (866) 843-0890 within the U.S., or +1 (412) 317-6597, and requesting the “Bluerock Residential Conference.”
For those who are not available to listen to the live call, the conference call will be available for replay on the Company’s website two hours after the call concludes, and will remain available until December 5, 2020 at http://services.choruscall.com/links/brg201105.html, as well as by dialing +1 (877) 344-7529 in the U.S., or +1 (412) 317-0088 internationally, and requesting conference number 10148742.
The full text of this Earnings Release and additional Supplemental Information is available in the Investor Relations section on the Company’s website at bluerockresidential.com.
About Bluerock Residential Growth REIT, Inc.
Bluerock Residential Growth REIT, Inc. (NYSE American: BRG) is a real estate investment trust that focuses on developing and acquiring a diversified portfolio of institutional-quality highly amenitized live/work/play apartment communities in demographically attractive knowledge economy growth markets to appeal to the renter by choice. The Company’s objective is to generate value through off-market/relationship-based transactions and, at the asset level, through value add improvements to properties and operations. The Company is included in the Russell 2000 and Russell 3000 Indexes. BRG has elected to be taxed as a real estate investment trust (REIT) for U.S. federal income tax purposes.
For more information, please visit the Company’s website at bluerockresidential.com.
Forward Looking Statements
This press release contains forward-looking statements within the meaning of the Private Securities Litigation Reform Act of 1995 and other federal securities laws. These forward-looking statements are based upon the Company’s present expectations, but these statements are not guaranteed to occur. Furthermore, the Company disclaims any obligation to publicly update or revise any forward-looking statement to reflect changes in underlying assumptions or factors, of new information, data or methods, future events or other changes. Investors should not place undue reliance upon forward-looking statements. Although the Company believes that the expectations reflected in these forward-looking statements are based on reasonable assumptions, the Company’s actual results and performance could differ materially from those set forth in these forward-looking statements due to numerous factors. Currently, one of the most significant factors is the potential adverse effect of the COVID-19 pandemic on the financial condition, results of operations, cash flows and performance of the Company and its tenants, partners and employees, as well as the real estate market and the global economy and financial markets. The extent to which COVID-19 impacts the Company and its tenants, partners and employees will depend on future developments, which are highly uncertain and cannot be predicted with confidence, including the scope, severity and duration of the pandemic, the actions taken to contain the pandemic or mitigate its impact (including governmental actions that may vary by jurisdiction, such as mandated business closing; stay-at-home orders; limits on group activity; and actions to protect residential tenants from eviction), and the direct and indirect economic effects of the pandemic and containment measures, including national and local employment rates and the corresponding impact on the Company’s tenants’ ability to pay their rent on time or at all, among others. For further discussion of the factors that could affect outcomes, please refer to the risk factors set forth in Item 1A of the Company’s Annual Report on Form 10-K filed by the Company with the U.S. Securities and Exchange Commission (“SEC”) on February 24, 2020, and subsequent filings by the Company with the SEC. We claim the safe harbor protection for forward looking statements contained in the Private Securities Litigation Reform Act of 1995.
Portfolio Summary
The following is a summary of our operating real estate and mezzanine/preferred/ground lease investments as of September 30, 2020:
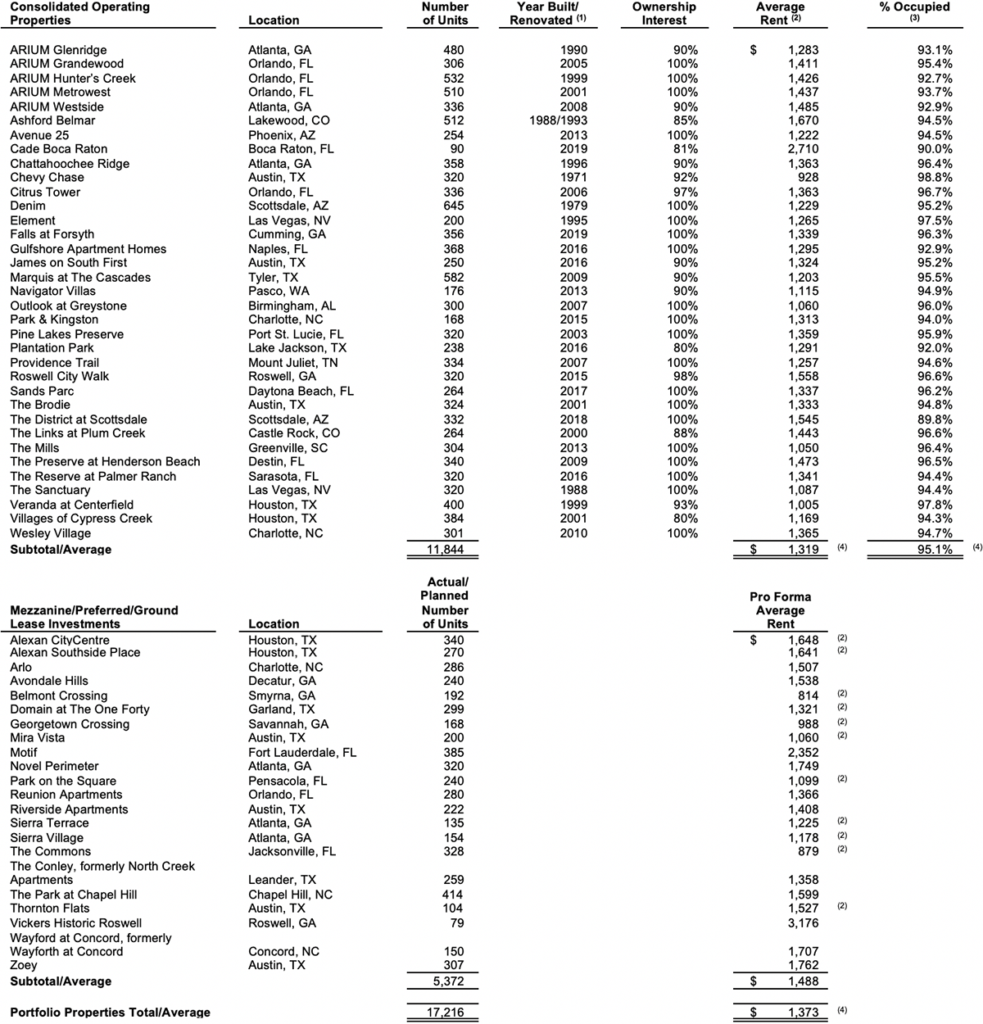
(1) Represents date of last significant renovation or year built if there were no renovations.
(2) Represents the average effective monthly rent per occupied unit for the three months ended September 30, 2020.
(3) Percent occupied is calculated as (i) the number of units occupied as of September 30, 2020, divided by (ii) total number of units, expressed as a percentage.
(4) Excludes The District at Scottsdale, which is in lease-up.
Consolidated Statement of Operations
For the Three and Nine Months Ended September 30, 2020 and 2019
(Unaudited and dollars in thousands except for share and per share data)
Consolidated Balance Sheets
Third Quarter 2020
(Unaudited and dollars in thousands except for share and per share amounts)
Non-GAAP Financial Measures
The foregoing supplemental financial data includes certain non-GAAP financial measures that we believe are helpful in understanding our business and performance, as further described below. Our definition and calculation of these non-GAAP financial measures may differ from those of other REITs, and may, therefore, not be comparable.
Funds from Operations and Core Funds from Operations
We believe that funds from operations (“FFO”), as defined by the National Association of Real Estate Investment Trusts (“NAREIT”) and core funds from operations (“CFFO”) are important non-GAAP supplemental measures of operating performance for a REIT.
FFO attributable to common shares and units is a non-GAAP financial measure that is widely recognized as a measure of REIT operating performance. We consider FFO to be an appropriate supplemental measure of our operating performance as it is based on a net income analysis of property portfolio performance that excludes non-cash items such as depreciation. The historical accounting convention used for real estate assets requires straight-line depreciation of buildings and improvements, which implies that the value of real estate assets diminishes predictably over time. Since real estate values historically rise and fall with market conditions, presentations of operating results for a REIT, using historical accounting for depreciation, could be less informative. We define FFO, consistent with the NAREIT definition, as net income, computed in accordance with GAAP, excluding gains or losses on sales of depreciable real estate property, plus depreciation and amortization of real estate assets, plus impairment write-downs of depreciable real estate, and after adjustments for unconsolidated partnerships and joint ventures. Adjustments for unconsolidated partnerships and joint ventures will be calculated to reflect FFO on the same basis.
CFFO makes certain adjustments to FFO, removing the effect of items that do not reflect ongoing property operations such as acquisition expenses, non-cash interest, unrealized gains and losses on derivatives, losses on extinguishment of debt and debt modification costs (includes prepayment penalties incurred and the write-off of unamortized deferred financing costs and fair market value adjustments of assumed debt), one-time weather-related costs, gain or losses on sales of non-depreciable real estate property, shareholder activism, stock compensation expense and preferred stock accretion. Commencing January 1, 2020, we did not deduct the accrued portion of the preferred income on our preferred equity investments from FFO to determine CFFO as the income is deemed fully collectible. The accrued portion of the preferred income totaled $0.4 million and $1.2 million for the three and nine months ended September 30, 2020, respectively. We believe that CFFO is helpful to investors as a supplemental performance measure because it excludes the effects of certain items which can create significant earnings volatility, but which do not directly relate to our core recurring property operations. As a result, we believe that CFFO can help facilitate comparisons of operating performance between periods and provides a more meaningful predictor of future earnings potential.
Our calculation of CFFO differs from the methodology used for calculating CFFO by certain other REITs and, accordingly, our CFFO may not be comparable to CFFO reported by other REITs. Our management utilizes FFO and CFFO as measures of our operating performance after adjustment for certain non-cash items, such as depreciation and amortization expenses, and acquisition and pursuit costs that are required by GAAP to be expensed but may not necessarily be indicative of current operating performance and that may not accurately compare our operating performance between periods. Furthermore, although FFO and CFFO and other supplemental performance measures are defined in various ways throughout the REIT industry, we also believe that FFO and CFFO may provide us and our stockholders with an additional useful measure to compare our financial performance to certain other REITs.
Neither FFO nor CFFO is equivalent to net income, including net income attributable to common stockholders, or cash generated from operating activities determined in accordance with GAAP. Furthermore, FFO and CFFO do not represent amounts available for management’s discretionary use because of needed capital replacement or expansion, debt service obligations or other commitments or uncertainties. Neither FFO nor CFFO should be considered as an alternative to net income, including net income attributable to common stockholders, as an indicator of our operating performance or as an alternative to cash flow from operating activities as a measure of our liquidity.
We have acquired six operating properties, made eight investments through mezzanine loans, preferred equity interests or ground lease investments, and sold five operating properties subsequent to September 30, 2019. The results presented in the table below are not directly comparable and should not be considered an indication of our future operating performance.
The table below reconciles our calculations of FFO and CFFO to net (loss) income, the most directly comparable GAAP financial measure, for the three and nine months ended September 30, 2020 and 2019 (in thousands, except per share amounts):
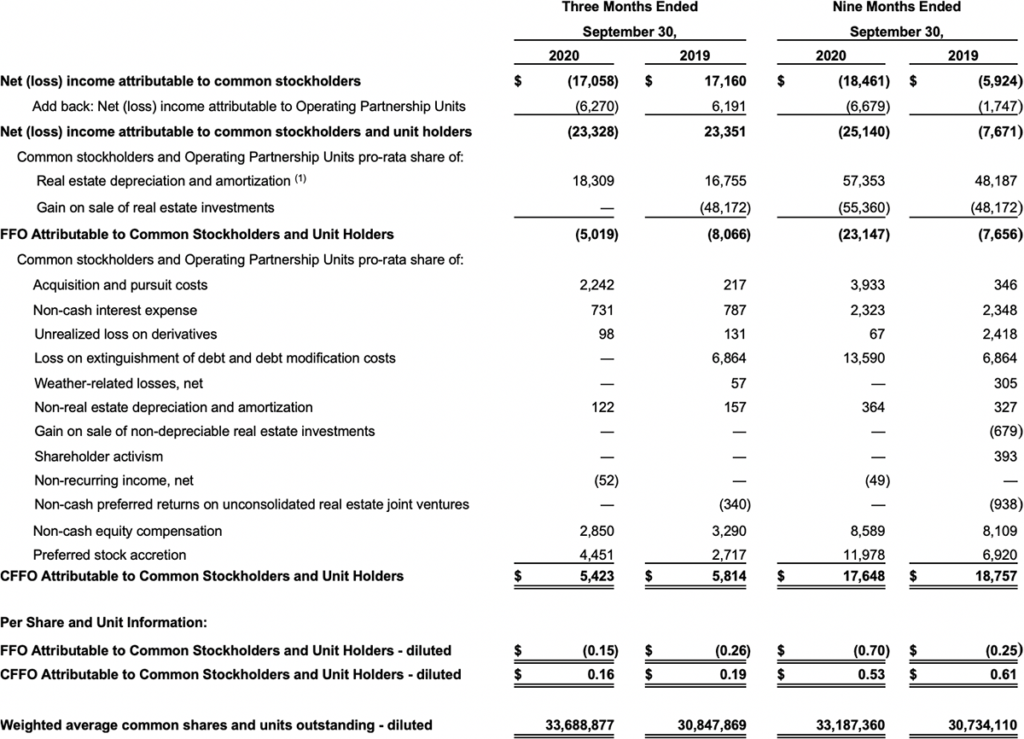
(1) The real estate depreciation and amortization amount includes our share of consolidated real estate-related depreciation and amortization of intangibles, less amounts attributable to noncontrolling interests for partially owned properties, and our similar estimated share of unconsolidated depreciation and amortization, which is included in earnings of our unconsolidated real estate joint venture investments.
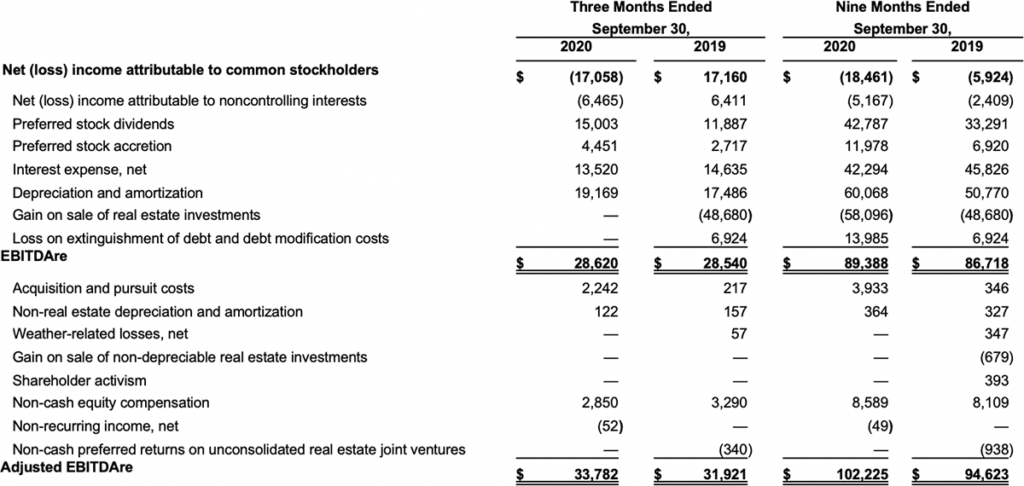
Earnings Before Interest, Taxes, Depreciation and Amortization for Real Estate (“EBITDAre”)
NAREIT defines earnings before interest, taxes, depreciation and amortization for real estate (“EBITDAre”) (September 2017 White Paper) as net income (loss), computed in accordance with GAAP, before interest expense, income taxes, depreciation and amortization expense, and further adjusted for gains and losses from sales of depreciated operating properties, and impairment write-downs of depreciated operating properties.
We consider EBITDAre to be an appropriate supplemental measure of our performance because it eliminates depreciation, income taxes, interest and non-recurring items, which permits investors to view income from operations unobscured by non-cash items such as depreciation, amortization, the cost of debt or non-recurring items.
Adjusted EBITDAre represents EBITDAre further adjusted for non-comparable items and it is not intended to be a measure of free cash flow for our management’s discretionary use, as it does not consider certain cash requirements such as income tax payments, debt service requirements, capital expenditures and other fixed charges.
EBITDAre and Adjusted EBITDAre are not recognized measurements under GAAP. Because not all companies use identical calculations, our presentation of EBITDAre and Adjusted EBITDAre may not be comparable to similarly titled measures of other companies.
Below is a reconciliation of net (loss) income attributable to common stockholders to EBITDAre (unaudited and dollars in thousands).
Same Store Properties
Same store properties are conventional multifamily residential apartments which were owned and operational for the entire periods presented, including each comparative period.
Property Net Operating Income (“Property NOI”)
We believe that net operating income, or NOI, is a useful measure of our operating performance. We define NOI as total property revenues less total property operating expenses, excluding depreciation and amortization and interest. Other REITs may use different methodologies for calculating NOI, and accordingly, our NOI may not be comparable to other REITs. We believe that this measure provides an operating perspective not immediately apparent from GAAP operating income or net income. We use NOI to evaluate our performance on a same store and non-same store basis; NOI measures the core operations of property performance by excluding corporate level expenses and other items not related to property operating performance and captures trends in rental housing and property operating expenses. However, NOI should only be used as a supplemental measure of our financial performance.
The following table reflects net (loss) income attributable to common stockholders together with a reconciliation to NOI and to same store and non-same store contributions to consolidated NOI, as computed in accordance with GAAP for the periods presented (unaudited and amounts in thousands):
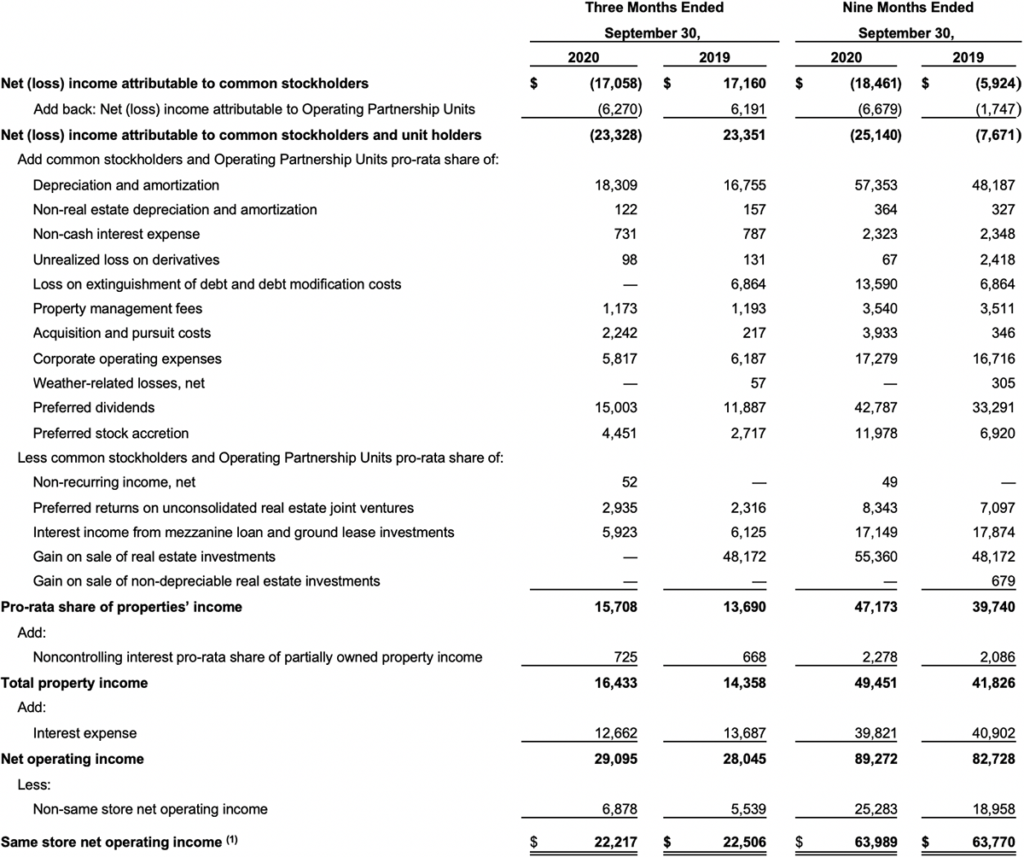
(1) Same store portfolio for the three months ended September 30, 2020 consists of 26 properties, which represent 8,993 units. Same store portfolio for the nine months ended September 30, 2020 consists of 24 properties, which represent 8,459 units.